
The Role of Digital Technology in Climate Technology Innovation†
Abstract
In this paper, I empirically estimate the relationship between digital technology and climate technology using the United States Patent and Trademark Office’s patent database. I find that innovation in digital technology increases the number of patents for climate technology by 17.3% on average, with digital data-processing technology and machine-learning-related technologies especially playing a key role in this relationship. Designing and implementing detailed policies that take into account the relationship between the two technologies will help us reduce the time required to achieve carbon neutrality and shift to the digital economy.
Keywords
Digital Technology, Climate Technology, ICT Energy Consumption, Energy Efficiency
JEL Code
O31, O33, O38, Q48, Q54, Q55, Q58
I. Introduction
Climate change and the digital transformation are two of the most important phenomena that have been transforming our daily lives, and they will continue to do so for many years to come. Consequently, researchers have extensively studied both topics in recent years, and governments in various countries are currently discussing and creating policies to address these changes. 1 In terms of technological development, the two phenomena could be either complementary or confrontational. For instance, the implementation of smart grid technology, which can be widely adopted with the help of digital transformation, could help mitigate climate change by promoting efficient electricity usage, distribution, and trade (European Commission, 2020). In this case, the advancement of digital technology helps mitigate climate change. However, the proliferation of digital transformation could also accelerate climate change. Data centers, which support digital transformation, consume energy intensively and contribute to heat emission problems. Consequently, the direct negative impact of the digital transformation process on climate change grows as the number of data centers increases. 2 Moreover, the semiconductor manufacturing industry, which is crucial for the digital transformation, is a major energy-intensive sector. As the transition to clean renewable energy is not yet complete, some of the energy required for semiconductor manufacturing must be produced using fossil fuels. Therefore, the increasing demand for semiconductors due to the digital transformation will raise greenhouse gas (GHG) emissions and have an adverse effect on the climate.
Nonetheless, the microfabrication process, which is the primary technological breakthrough in the semiconductor manufacturing industry, allows semiconductors to process the same information while using less energy. 3 As a result, this innovation reduces the amount of electricity used in all places that utilize semiconductors, from typical households to data centers. In fact, Masanet et al. (2020) demonstrates that although the volume of information processed increased by 550% from 2010 to 2018, the electric power required by data centers only rose by 6%. This improvement was due to the enhanced efficiency of microprocessors and the reduction of idle power usage, resulting in a swift decline in the amount of electric power required to process the same amount of information.
More direct examples of climate technologies which use digital technologies include building efficiency technologies and sustainable agriculture technologies. By utilizing digital technologies, building owners and operators can monitor and adjust their heating, ventilation, and air conditioning (HVAC) systems more efficiently, resulting in reduced energy usage and lower carbon emissions. Similarly, digital technologies can help reduce fertilizer and water use. Digital tools such as sensors and drones can be used to monitor crop growth and soil conditions, enabling farmers to make more informed decisions about when and how much to water and fertilize their crops. By optimizing these inputs, farmers can reduce waste and improve yields while also minimizing the environmental impact of their farming practices. These are just a few of the examples showing how the integration of digital technologies in climate technologies can offer new opportunities to reduce greenhouse gas emissions and mitigate the effects of climate change while also increasing efficiency and productivity in various sectors. These climate technologies would not exist if digital technologies were not present.
Innovation in digital technology can help mitigate climate change through various channels, as is clear from these previous examples. Thus, climate policies that can lower the returns from investments in digital technologies, such as those that hamper the construction and expansion of data centers or semiconductor manufacturing facilities, could adversely affect climate change prevention efforts by reducing the innovation rate of digital technology. Because digital transformation and climate change affect each other in various dimensions, the European Union, for example, seeks to understand the interaction between the two and makes an effort to design policies reflecting these relationships.4 In Korea, however, we lack discussions of the relationship between digital transformation and climate change and its mid- to long-term effect in terms of policy design. Also, to the best of my knowledge, there is no study examining the relationship between digital technology and climate technology and discussing its policy implications.
Thus, in this paper, I study the relationship between digital technology and climate technology to enrich our understanding of the relationship between the digital transformation and climate change. Then, I derive implications related to the relationship between climate policy and digital transformation policy. To do this, I empirically estimate the relationship between digital technology and climate technology using the United States Patent and Trademark Office’s (USPTO) patent database. I use patent technology classification codes included in the patent data to classify patents for digital technology and patents for climate technology and examine the relationship between the two technologies using detailed sub-classifications for each technology. By using country information for inventors and owners for each patent included in USPTO’s patent data, I construct and use country-technology-year-level data in the analysis.
In the empirical analysis, I find the following results. First, innovation in digital technology increases the number of patents for climate technology by 17.3% on average, and digital data-processing technology and machine-learning-related technologies especially play a key role in this relationship. Second, digital data-processing technology and machine-learning-related technologies positively affect developments in smart-grid-related technologies. Lastly, digital technology particularly helps with advancements in energy-saving building technologies, GHG processing and reduction technologies, technologies to reduce the energy used by information and communication technology (ICT), and green transportation technologies. However, statistically significant results on the effects of climate technologies on digital technology could not be found for the purposes of this paper. Designing and implementing detailed policies that take into account the relationship between the two technologies will help us to reduce the time required to achieve carbon neutrality and shift to the digital economy.
The rest of this paper is organized as follows. Chapter II introduces previous studies related to this paper. Chapter III explains the data and measures used in the empirical analysis. Chapter IV explains the empirical model specification and presents the analysis results. Chapter V discusses policy implications. Finally, Chapter VI concludes the paper.
II. Literature Review
Numerous studies have examined the impact of digital transformation on climate change, focusing mainly on its effect on energy consumption. Horner et al. (2016) have analyzed these studies and explained how ICT (which includes computers, mobile devices, and networks) can both decrease or increase energy consumption. The direct energy effect of ICT stems from its energy usage during its operation and manufacturing. The indirect energy effect is the result of changes in energy consumption when ICT is used to modify the way we use existing products and services. Examples of the latter include using smart building technologies to adjust air flows in real time or reducing air travel through online conferences. Moreover, e-commerce has altered the energy use composition for goods transportation. Horner et al. (2016) suggest that the indirect energy effect does not necessarily reduce energy use, as e-commerce has increased freight volumes to improve delivery outcomes. Nevertheless, previous research suggests that the indirect energy effect has the potential to reduce energy use significantly depending on efficient technology usage and consumer behavior.
Koomey et al. (2011) focus on examining advancements in microprocessor technology and how these have contributed to reducing energy consumption. They show that the computation per kilowatt-hour for microprocessors doubled every 18 months from 1946 to 2009 owing to the development of computer technology and transistor miniaturization. Also, because the theoretical limit for the computation per kilowatt-hour improvement is 2.5 × 10⁶ times higher than what was realized up to 2009, there is much room for improvement in energy use, even in 2023 if we assume that the speed of improvement has remained the same since 2009. This suggests that, during the diffusion of digital transformation, energy usage across the economy could be reduced by decreasing ICT's energy consumption through these developments. Koomey et al. (2011)’s findings exemplify the economic significance of digital technology's impact on climate change, which is further elaborated on in this paper.
IEA (2022), on the other hand, compiles recent research findings on electricity consumption and GHG emissions resulting from the digital transformation. Compared to 2015, the number of internet users increased by 60%, internet data traffic rose by 440%, the overall processed data volume by data centers rose by 260%, and electricity usage by data centers and transmission networks increased by 10-60% and 20-60%, respectively, in 2021. In 2020, the share of GHG emissions from data centers out of the total GHG emissions was 0.6%, and the share of energy-related GHG emissions was 0.9%. Based on 2021 data, the global share of electricity used by data centers and transmission networks was around 2-2.7%. Thus, despite rapid diffusion, electricity consumption from digital transformation did not increase as quickly due to ICT energy efficiency improvements, the increased use of renewable energy by ICT firms, and economy-wide decarbonization efforts in the electric grid. Nonetheless, the IEA (2022) emphasizes that we need to reduce our electricity consumption by half by 2030 to reach the net-zero goal, despite these efforts.
While promoting efficient energy use is an important way by which the digital transformation can mitigate climate change, as demonstrated by the studies mentioned earlier, there are many other ways in which the digital transformation can contribute to this effort. According to CODES (2022), digital transformation efforts can move towards improving climate and social sustainability by sharing values and objectives, mitigating negative impacts on the environment and society, and driving innovation. The Global e-Sustainability Initiative (GeSI) (2015) highlights how ICT can reduce greenhouse gas emissions in crucial sectors such as manufacturing, agriculture, construction, and energy through automation and optimization, going beyond merely reducing their energy consumption. For instance, ICT is expected to have a positive impact on the environment by, for instance, increasing grain production by 30% in 2030 compared to 2020 through smart farming and significantly reducing water and oil consumption. The Royal Society (2020) not only documents empirical facts but also suggests specific ways to use digital technology to mitigate climate change. First, constructing data infrastructure to monitor GHG emissions can help data-based services reduce GHG emissions by providing stable and immediate access to data. Secondly, increasing efforts to use renewable energies in the digital sector can help them lower their GHG emissions. Finally, research and innovation can help find new ways for digital transformation efforts to mitigate GHG emissions.
Previous studies have shown that digital technology, or ICT, can help mitigate GHG emissions through efficiency gains in various tasks and by automation and improved electricity usage. In addition to these findings, I contribute to this literature by highlighting the potential for digital technology developments to impact the progress of climate technology directly.
III. Data and Measures
In this section, I explain the data and measures used to estimate the relationship between digital technology and climate technology. I provide a detailed explanation of how I construct the necessary measures using US patent data, as there are many factors to consider to use this data properly. The key in this section is the construction of a digital technology shock that is plausibly exogenous to firms’ other decisions that affect their climate technology development. Several papers, such as those by the OECD (2020), Kim et al. (2018), Miranda-Agrippino et al. (2019), and Sharma and Narayan (2022), particularly the last two, use patent databases to a construct technology shock. Miranda-Agrippino et al. (2019) construct an exogenous instrument variable for a technology news shock using residuals from the regression of the growth rate of the number of patent applications to its own lag along with predictions of macro-variables, monetary policy variables, and fiscal policy variables. They analyze the effects of these variables on macro and financial variables. Sharma and Narayan (2022) construct a technology shock using the detrended number of patent applications each year, where they detrend the number of patent applications using the previous five-year average number of patent applications for each year. The constructed technology shock is used to analyze the effect of this variable on stock returns.
Although there have been several efforts to estimate a technology shock using patent databases, there is no general method by which to do so. The key is to find changes in technology that are exogenous to the dependent variables of interest, and in this paper, I define a technology shock as a sharp increase (spike) in innovative technological development for each technology field. A detailed discussion of this measure is given in subsection C.
A. Data
I use the USPTO’s patent database to ascertain the levels of development in digital technology and climate technology for each OECD member country.5 The USPTO patent database provides detailed information on ultimately granted patent applications filed by individuals or firms worldwide, including abstracts, lists of previous patents cited, technology classes, lists of inventors, and names and addresses of owners and inventors. The USPTO patent database used for the analysis here contains a set of ultimately granted patent applications from 1976 to 2021. As is well known in previous studies that also use the USPTO patent database, it takes from one year to even as long as ten years, three years on average, for filed patent applications to be granted (see Figure 1-A). Thus, the patent granted year is too far away from the year the innovation occurred. Although the application year may not be the exact year the innovation occurred as well owing to the time required to prepare the patent application documents, this gap should be narrower. Thus, following the previous studies, I use the application year as a proxy for the year the technological innovation occurred.
Also, because the USPTO patent database contains only ultimately granted patent applications and given that the granting process excessively long, the number of patent applications filed falls rapidly after 2016, as shown in Figure 1-B. For example, most of the patent applications filed with USPTO in 2021 were under review as of 2021. Thus, the number of ultimately granted patent applications among the 2021 cohort is very low. Therefore, despite the possibility that the actual number of patent applications filed as well as the quality of the applications in 2021 may equal those factors for 2016 and thus that the number of ultimately granted patent applications counted in 2030 is identical in both years, the number of ultimately granted 2021 patent applications should be very low if counted in 2021. In other words, because the patent application examination process is long, the number of patents created by firms, hence in the economy in 2021, becomes observationally low compared to that in 2016 in the 2021 version of the USPTO patent database. To correct for such bias coming from this type of examination lag, I use patent applications filed up to 2016 in the subsequent analyses. Furthermore, I use the patent applications filed by entities in the 38 OECD member countries in the upcoming analyses, as these should be comparable in terms of the quantity, quality, and composition of the technologies.
To classify the technology of each patent, I use USPTO’s Cooperative Patent Classification (CPC) scheme in the following analyses, which USPTO constantly updates to maintain time consistency throughout all of the years the patent data are available. There are nine codes in the 1-digit CPC section, 130 in the 3-digit CPC class, and 670 in the 4-digit CPC subclass. Table 1 shows the number of patent applications and the number of CPC codes for the top ten OECD member countries in terms of the total number of patent applications in 2016. Table A1 in the Appendix shows the same information for all 38 OECD member countries. For more detailed explanations and analyses of the USPTO patent database, I refer to Hall et al. (2001).
B. Climate Technology and Digital Technology Definitions
As briefly explained previously, USPTO assigns one or more CPC codes to each patent to classify the technologies each patent contains. Among these CPC codes, Y02 is the code USPTO additionally assigns to patents to track the developments in technologies related to mitigation and adaptation to climate change. This code was initially developed jointly by the European Patent Office (EPO), the United Nations (UN), and the International Centre on Trade and Sustainable Development (ICTSD) and used thereafter. To develop an automated way to assign Y02 to relevant patents, climate technology experts from the three institutions first applied textual analysis to all available descriptions in the patent database, such as abstracts and claims, to select patents broadly related to climate technology. The experts then manually inspected and removed false matches using additional information, such as technology classifications, to finalize the assignment. This routine is developed as an algorithm that can automatically assign Y02 to new patents under the supervision of patent experts, and this algorithm has been maintained and updated constantly. See Veefkind et al. (2012) for a more detailed explanation. Thus, in this paper, I classify patents assigned to Y02 as patents for climate technology. For example, Y02C under Y02 is for technologies to capture, store, sequestrate, or dispose of GHG, and especially Y02D is for technologies to lower the power consumption of ICT products by, for instance, low-power computing.
Among CPC classes, G06 pertains to technologies for computing, calculating, and counting. Under G06, six subclasses, G06F, G06K, G06N, G06Q, G06T, and G06V, are codes assigned to technologies related to digital transformation technologies. Thus, I classify patents assigned to these six subclasses as patents for digital technology. For example, one of the CPC groups under G06N, G06N 20/00, is for machine-learning-related technologies, and one of the CPC groups under G06F, G06F 1/32, is for technologies for lowering device power consumption levels by processing digital data.
Figure 2 shows digital and climate technology development trends worldwide, where the degree of development is measured as the share of patent applications for digital and/or climate technology from the total number of patent applications filed each year. 6 Because each patent is assigned to one or more CPC, there are cases in which a patent is assigned to both digital technology and climate technology. In such cases, I include the patents in both pools of patents for digital and climate technologies when counting the number of patents in the corresponding pools. Then, I additionally define climate + digital technology — technology used for both climate change mitigation and digital transformation — and compute a trend for the development of such technology separately. The share of patents for climate technology among the patents registered with USPTO stagnated in the 1980s and 1990s and then showed a steady increase in the 2000s. This was followed by another period of stagnation after 2010. In contrast, the share of patents for digital technology showed a steady increase in all periods. Also, the share of patents for climate + digital technology, such as G06F 1/32, showed a steady increase in all periods as well.
C. Different Revenue Uses from a Carbon Tax
To estimate the effect of digital technology on climate technology and vice versa, I define a rapid increase (spike) in the number of innovative technological improvements as a technology shock for each technology and compute as follows. Just as research papers, patents are required to cite all of the previous patents their technological improvements are based on or related to. Thus, previous studies using the patent database use the number of forward citations received as a measure of the quality or degree of improvement (innovation) each patent contains. Thus, I define patents with the number of forward citations received above the 99th percentile of the forward citation distribution for all patents worldwide as patents related to innovative technological improvements.
In this paper, I use the technology-year mean-adjusted values for the number of forward citations received, where the technology is defined at CPC4-level. As is well documented in Hall et al. (2001), both the number of patents created each year and the corresponding trend vary across different technologies. Thus, the number of patents which could potentially cite a specific patent may differ for each technology and year. Also, patents that were created in early periods have the potential mechanically to receive more citations compared to recent patents. In an extreme case, patents created today should have received zero citations. Due to these reasons, for example, a patent related to internal combustion engines created in 1990 and that received 2,000 forward citations could have a lower degree of innovation than an AI-related patent created in 2021 that received 50 forward citations. Thus, it is necessary to adjust for these biases in the number of forward citations to use this measure correctly to assess the quality of patents or the degree of innovation each patent contains. To do this, I compute the average number of forward citations received by patents in each technology-year and divide the number of forward citations each patent in each technology-year received by this average number accordingly.7
Then, I define the share of the number of patents for innovative technological improvements from all patents as a measure of the degree of innovative technological improvement for each technology. Here, I use the technology-year mean-adjusted number of forward citations received when counting the number of patents to take the quality of innovation into account. Finally, I compute the DHS (Davis, Haltiwanger, and Schuh, 1998) growth rate of this degree of innovative technological improvement for each technology-year, defining the year when the growth rate is above the 75th percentile of the growth rate distribution for each technology as the year the technology shock (spike) occurred for that technology. According to this methodology, the years the digital technology shock occurred within the regression sample period (1983 to 2016, a total of 34 years) are 1983, 1987, 1989, 1991, 1995, 1999, 2001, 2003, 2004, and 2010 (a total of ten years). For 2010, such digital technology shocks include a total of 495 versatile patents, such as “Electronic Device with Text Error Correction Based on Voice Recognition Data” (Apple, US8719014), “System and Method for Calculating the Thermal Mass of a Building” (Ecofactor Inc., US8131497), Digital Mapping System (Google LLC, US7894984), and “Controlling Power Consumption of a Mobile Device Based on Gesture Recognition” (Qualcomm Inc., US9086875). We could think of other ways to measure a digital technology shock, such as finding an exogenous shock to digital technology, including government policy changes, and using them as instrument variables. However, I was unable to find such exogenous variations.
IV. Empirical Analysis
In this section, I estimate the effect of digital technology on climate technology for various levels of technological aggregation.
A. Model Specifications
To estimate the effect of digital technology (a subset of G06 defined previously) on climate technology (Y02), I estimate the following regression model:

The dependent variable log(npatcjt) that represents the developments in technology j is the number of patent applications for each technology ( j ) in each country ( c ) in year t. As explained previously, I use the technology-year mean-adjusted number of forward
citations received when counting the number of patent applications to take into account
the quality of innovation, where CPC4 is used for the technology classification. The
independent variable  is a dummy variable equal to one if technology j belongs to the climate technology Y02, and
  is a dummy variable equal to one if we observe a digital technology shock in year
t-s. Thus, the coefficient in front of the interaction term
is a dummy variable equal to one if we observe a digital technology shock in year
t-s. Thus, the coefficient in front of the interaction term 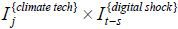 , β1 estimates the additional effect of digital technology shock s years ago on climate technology compared to all other technologies. Because it takes
time for the USPTO examiners to evaluate the patent applications submitted to the
USPTO, to protect their rights, and to make the information available to the public,
s should be more than one year. Also, because other firms need time to learn the available
information and apply it to their technological developments and then spend more time
preparing and submitting patent applications to the USPTO, s should be more than two years. Thus, I use s = 3 in the baseline regression analysis. To test the robustness of the results, I
also use various values of s and report the results in Table B1 in the Appendix. The coefficient estimate for the effect of a digital technology
shock in the same year on climate technology, however, is small and statistically
insignificant.
, β1 estimates the additional effect of digital technology shock s years ago on climate technology compared to all other technologies. Because it takes
time for the USPTO examiners to evaluate the patent applications submitted to the
USPTO, to protect their rights, and to make the information available to the public,
s should be more than one year. Also, because other firms need time to learn the available
information and apply it to their technological developments and then spend more time
preparing and submitting patent applications to the USPTO, s should be more than two years. Thus, I use s = 3 in the baseline regression analysis. To test the robustness of the results, I
also use various values of s and report the results in Table B1 in the Appendix. The coefficient estimate for the effect of a digital technology
shock in the same year on climate technology, however, is small and statistically
insignificant.
δct is a country-year fixed effect to control for country-level transitory components
that could affect technological development trends and the patent application submission
difference across countries. Given that is absorbed by δct , it is not included as an independent variable separately. δct is a country-technology fixed effect to control for the difference in the compositions
of technological developments across countries. Because is absorbed by δcj, it is not included as an independent variable separately. α is a constant term. As we need to use the three-year prior technology shock in this
regression, I limit the analysis sample period to the years 1983 to 2016 (34 years).
There are 38 countries with 666 CPC4 in this regression sample, and the total number
of observations is 241,402. The mean and standard deviation of the dependent variable
log(npatcjt) are 1.97, and 1.78, respectively. The number of years in which a digital technology
shock amounts to ten, as explained previously.
B. Baseline Result
Table 2 shows the baseline regression results for no fixed effects, the country-year fixed effect only, the country-technology fixed effect only, and both the country-year and the country-technology fixed effects included. As shown in the figure, the estimates for β1 are positive and statistically significant for all combinations of fixed effects. The results for the main specification in column four show that a digital technology shock additionally increases the number (technology-year-adjusted number of forward citations received) of climate-technology-related patents by 1.24 (exp(0.213)), compared to all other technologies. As the average number of climate-technology-related patents each year is 7.17 (exp(1.97)), this result shows that a digital technology shock increases the number of climate-technology-related patents by around 17.3% on average. This is an important result showing that, in addition to the previous findings that the digital transformation process helps mitigate climate change by reducing energy use in various ways, the development of digital technology additionally helps mitigate climate change by promoting the development of climate technology, which is very important in the long run. Thus, it is clear that government policies related to the development of digital technology should have an important effect on the development of climate technology.
C. Technology Shock Measure Validation and Robustness Test
To test whether the technology shock measure used for the previous analysis captures a simple trend or spurious relationship between digital technology and climate technology, first I regress the current ( t ) climate technology on the future ( t + s ) digital technology shock measure. Because I need to compute the future technology shock, I limit the regression sample period so that it ranges from 1983 to 2013. The first column of Table 3 shows the result for s = 3. As shown in the table, the coefficient is small and statistically insignificant. Thus, there is a low possibility that the current digital technology shock measure simply captures spurious relationships. Table B2 in the Appendix shows the results for s = 1 and s = 2 . We can observe that the coefficient for s = 1 is statistically significant at 10%. This may stem from the possible release of information for the developed technology before patent application submission, or the large sample size (221,532 observations). However, this result requires further analysis. For s = 2 , the result is statistically insignificant.
The second column in Table 3 shows the estimate of the effect of a digital technology shock on all technologies. This is computed to test whether we obtain the baseline results not because the digital technology shock measure indeed captures its effect on climate technology but because it captures its effect on overall technology or because there is merely a spurious relationship. However, the resulting coefficient estimate is small and statistically insignificant, implying that the possibility of such concerns actually coming to be is low.
The third column in Table 3 shows the estimate of the effect of a climate technology shock on digital technology. This reverse causality estimation allows us to test whether the baseline results are driven by a simple correlation or a common trend between digital technology and climate technology and not by the effect of digital technology. This test is important as there is no strong reason as to why climate technology can directly affect digital technology. As shown, the result is statistically insignificant. Thus, the baseline result is likely not capturing a simple correlation.
The fourth column of Table 3 shows the result including 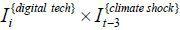 in the baseline regression specification (1) to estimate the effect of digital technology
on climate technology, controlling for the effect of a climate technology shock on
digital technology. As shown, the coefficient estimates are identical to those before.
in the baseline regression specification (1) to estimate the effect of digital technology
on climate technology, controlling for the effect of a climate technology shock on
digital technology. As shown, the coefficient estimates are identical to those before.
TABLE 3
ROBUSTNESS CHECK FOR THE EFFECT OF DIGITAL TECHNOLOGY SHOCK I
Note: 1) Statistical significance levels: ***p<0.01, **p<0.05, *p<0.1; 2) Standard errors in parentheses.
Finally, Table 4 shows whether the baseline results hold even after controlling for the effect of past (three years prior) climate technology shocks on climate technology itself. I run this test as the baseline estimates could be biased if climate technology shocks happened to occur simultaneously with digital technology shocks. However, even when controlling for climate technology shocks, the effect of a digital technology shock remains statistically identical to the baseline result. Furthermore, as shown in the fourth column, the effect of a climate technology shock becomes statistically insignificant after controlling for full fixed effects. All of the results above suggest that the baseline regression result more likely identifies the (causal) effect of digital technology on climate technology than otherwise.
TABLE 4
ROBUSTNESS CHECK FOR THE EFFECT OF DIGITAL TECHNOLOGY SHOCK II
Note: 1) Statistical significance levels: ***p<0.01, **p<0.05, *p<0.1; 2) Standard errors in parentheses.
Additionally, I estimate the effect of a digital technology shock on climate + digital technology, as briefly explained in the previous section. Although the share of patents for this type of technology is quite small (0.6% of the total number of patents), as shown in Figure 2, it could be used as an additional robustness test for the baseline results, removing the indirect effect of digital technology, as it is an aspect of climate technology that directly uses digital technology. In this regression analysis, the dependent variable is the country-year-level logged citation-adjusted number of forward citations for patents pertaining to climate + digital technology, and the independent variable is the yearly-level dummy variable for a digital technology shock. Thus, I include the country-fixed effect only in this regression. These results are reported in Table B3 in the Appendix. The coefficient estimate of 0.304 is similar to the baseline result. However, the statistical significance is low (10%) as the regression sample is at the country-year level, with the number of observations equal to 1,197.
Furthermore, I estimate the effect of a digital technology shock on climate technology after separating climate + digital technology from digital technology and climate technology to remove any potential bias that could arise due to a potentially mechanical relationship between a digital technology shock and some of the climate technologies that are actually climate + digital technologies. As reported in the second column of Table B4 in the Appendix, the coefficient estimate is statistically identical after reassigning the climate + digital technology. For comparison purposes, the first column shows the baseline result.
Finally, Table B5 in the Appendix shows the estimate of the effect of digital technology on climate technology, estimated by directly regressing the (logged) number of patent applications for climate technology on the three-year lagged (logged) number of patent applications for digital technology. The advantage of the baseline model over this regression model is that we can isolate the effect of digital technology on climate technology from other factors that could shift both technologies simultaneously, such as a spurious common trend. Additionally, we can estimate the effect of digital technology specific to climate technology by comparing it to the effects of other technologies. Nonetheless, this exercise can also confirm the robustness of the baseline results. Here, only country and time-fixed effects are separately included in this regression specification, as we only have the country-year variations.
As shown in the first column, the coefficient estimate of 0.333 is statistically identical to the baseline estimate of 0.213 reported in Table 2. The second column in Table B5 estimates an additional effect of the year the digital technology shock occurred on climate technology by testing the interaction between the three-year lagged (logged) number of patent applications for digital technology and the digital technology shock measure used in the baseline model. Unless these years are special with regard to the development of climate technology notwithstanding the fact that these are years digital technology shocks occur, all of the digital-technology-specific effects should be absorbed by the number of patent applications for digital technology. Consistent with this perceptive, we have a statistically insignificant and small coefficient for the interaction term. All of the tests above confirm that the baseline estimate of the effect of digital technology on climate technology is robust to many other specifications.
D. Extension I
To understand how digital technology affects climate technology in more detail, I
extend the baseline regression specification and run several additional analyses.
In the first extension, I test whether digital technology affects climate technology
differentially in Korea compared to other OECD member countries. I run this test as
we need to find causes and find ways to improve the relationship between the two technologies
if we find that the effect is lower in Korea. To do this, I additionally test the
interaction of a dummy variable for Korea ( ) with the baseline specification. As shown in the second row of the first column
in Table 5, the result is statistically insignificant for the triple-interaction term. Thus,
the relationship between the two technologies is due to their specific characteristics
at the technology level, and I could not find evidence that their relationship is
different in Korea due to government policies or the level of technological development.
) with the baseline specification. As shown in the second row of the first column
in Table 5, the result is statistically insignificant for the triple-interaction term. Thus,
the relationship between the two technologies is due to their specific characteristics
at the technology level, and I could not find evidence that their relationship is
different in Korea due to government policies or the level of technological development.
The next extension is to estimate the effect of digital technology on smart grid technology (Y04), and this result is reported in the second column of Table 5. The coefficient estimate, however, is statistically insignificant. This may stem from the fact that AI-related technological development, which is expected to have a large impact on smart grid technology, showed major developments after 2016. Thus, this result requires further analysis after compiling a longer dataset. Furthermore, this result may be driven by the fact that we are actually combining various detailed digital technologies and using an aggregated form of digital technology in the analysis. If some of these detailed digital technologies have offsetting effects on smart grid technology, such a result would arise. The results when testing the validity of the above extension analyses are reported in Table B6 in the Appendix.
E. Extension II
Because the technology shock measure used in this paper is a dummy variable that assumes zero or one at the annual level, it cannot be a good measure of fine technology classifications because we would not be able to separate different fine technologies’ movements correctly with annual-level zero one values if these fine technologies co-move in a broad sense. With this limitation in mind, I estimate the effects of finely defined digital technologies in the digital technology used in the baseline analysis on climate technology and examine the effect of digital technology in detail.
Table 6 shows the results for Electric Digital Data Processing (G06F), Computing Arrangements Based on Specific Computational Models (Machine Learning-related technologies, G06N), and Image Data Processing or Generation in General (G06T). 8 We see that climate technology is significantly affected by these three technologies, which exist at the heart of digital technologies. These findings not only help us to understand the detailed role of the digital transformation on climate change mitigation as explored in the previous studies but also highlight the additional importance of digital technological developments on climate change mitigation. I will discuss this in detail in the next section, where I analyze the effects of digital technology on finely defined climate technologies. I report the regression results to test the validity of these results using the future technology shock in Table B7 in the Appendix.
TABLE 6
EFFECTS OF DETAILED DIGITAL TECHNOLOGY SHOCKS ON CLIMATE TECHNOLOGY
Note: 1) Statistical significance levels: ***p<0.01, **p<0.05, *p<0.1; 2) Standard errors in parentheses.
In addition to these aspects, I estimate the effects of finely defined digital technology on smart grid technology. These results are reported in Table 7. In the previous analysis using aggregated digital technology, the estimated coefficient was statistically insignificant. Here, I find statistically significant results at the 10% level for data-processing-related technology and machine-learning-related technology. In fact, it may be possible to obtain statistically more stable (significant) results for these in a few years when a longer dataset becomes available, as machine-learning-related technologies improved rapidly after 2016, and smart grid technology is also relatively new. The robustness test for these analyses using a future technology shock is reported in Table B8 in the Appendix.
F. Extension III
Finally, I analyze the effects of digital technology on finely defined climate technology. As shown in Tables 8 and 9, digital technology has clear effects on six finely defined climate technologies out of eight: Climate Change Mitigation Technologies Related to Buildings (Y02B); Capture, Storage, Sequestration or Disposal of GHG (Y02C); Climate Change Mitigation Technologies in ICT (Y02D); Reduction of GHG Emissions, Related to Energy Generation, Transmission or Distribution (Y02E); Climate Change Mitigation Technologies in the Production or Processing of Goods (Y02P); and Climate Change Mitigation Technologies Related to Transportation (Y02T).9 Below are some examples that can help us understand what these findings mean and how they are materialized in the real world.
TABLE 8
EFFECTS OF A DIGITAL TECHNOLOGY SHOCK ON DETAILED CLIMATE TECHNOLOGIES I
Note: 1) Statistical significance levels: ***p<0.01, **p<0.05, *p<0.1; 2) Standard errors in parentheses.
In 2016, Google was able to reduce the electricity they used to dissipate the heat produced by their data center servers by 40% and lower the data center’s power usage effectiveness (PUE) by 15% by finding a way to control the building’s HVAC efficiently using DeepMind’s machine learning technology.10 A lower PUE implies higher energy efficiency. Google expects that this technology could lower electricity and water used in power plants and semiconductor manufacturing factories. Google’s effort in this way to apply digital technology newly to climate technology gave birth to several startups with HVAC optimization of buildings as their business focus. One example is BrainBox AI, and such innovations by these startups have reduced GHG emission levels of residences, hotels, airports, and grocery stores by 20~40%. Also, according to BrainBox AI, their customers were able to lower their electricity bills by 25%.11 US969723 is the patent filed by BrainBox AI in February of 2019 to the USPTO, which was granted in January of 2021, and this patent is for a system and methods of optimizing HVAC control in a building or network of buildings. This technology, categorized as G06N (machine learning-related technology), processes HVAC-related historical data, weather forecasts, and occupancy rates through machine learning to find and utilize the optimal HVAC requirements. This new technology started by Google clearly demonstrates the large contribution to Climate Change Mitigation Technologies Related to Buildings (Y02B). Also, as Google claims, this new technology will make an important contribution to the development of the technology categories of Reduction of GHG Emissions, Related to Energy Generation, Transmission or Distribution (Y02E), and Climate Change Mitigation Technologies in the Production or Processing of Goods (Y02P). This type of machine-learning-based technology will contribute to climate change mitigation by helping to improve existing technologies and heralding the birth of new technologies.
Image Data Processing or Generation technology (G06T) helps mitigate climate change in various fields. It helps computers to analyze video data from traffic cameras in real time to control traffic signals and solve the traffic congestion problem, which ultimately lowers GHG emissions. This technology also helps analyze satellite images to find methane gas leaks. The Carbon Mapper Satellite Sensor, developed by joint partners including Planet Labs, NASA, the state government of California, and the University of Arizona, is a good example of using image data-processing technology to find areas with methane gas and carbon dioxide leaks. 12 Owing to such image data-processing technologies, we are able to find problematic areas in real time and mitigate climate change by solving the problems using GHG processing technologies (Y02C). This type of technology will also be used in new areas and will greatly help us to mitigate climate change in the near future. I will discuss examples where data-processing-related technologies, such as technologies for power consumption reductions using data processing, are used for climate technologies, including ICT-related electricity consumption reduction technology, in the next section while discussing policy implications. The analysis results using a future technology shock to test the validity of the results above are reported in Table B9 and B10 in the Appendix. I also analyzed the effects of finely defined digital technologies on finely defined climate technology. I do not include the results from this analysis because they are not stable, which may be due to the possible limitation of the technology shock measure used, as discussed previously, or due to the mismeasurement issue that can arise when dividing data too finely. I plan to re-run this analysis once I find a way to measure a technology shock in a continuous manner.
V. Discussion
In this section, I discuss policy implications derived from the previous analysis results. Here, I focus on government policies that could help promote development in the area of digital technology.
A. Policies for supporting development in technologies for reducing power consumption by ICTs
As shown in previous studies and by the real-world examples discussed in the previous sections, the digital transformation, especially that of AI technology that uses high-performance computers and data centers, will play an even more significant role in climate change mitigation. Moreover, as illustrated by the previous analysis results in this paper and the results from other papers, it is not easy for us to disagree that digital technology can mitigate climate change by improving and being combined with climate technology. However, it is also a fact that high-performance computers and data centers negatively affect climate change due to their intensive power consumption. As I introduced in the previous sections, many existing studies and policy institutions worry about and discuss this intensive energy use as it pertains to digital technology. Koomey et al. (2011) and the IEA (2022) show that although developments in digital technology improve energy efficiency even more rapidly than performance improvements, there is room for improving energy efficiency even more, and we need to speed this up to accomplish the net-zero goal by 2050. For these reasons and because the pace of the digital transformation and electrification of energies will increase, the importance of technologies for reducing ICT power consumption levels will progressively increase.
Figure 3 shows a specific example where data-processing-related technology (G06F), including technologies for power consumption through data processing, is applied to a technology for reducing power consumption by ICTs. This is a patent about reducing energy consumption by computer processors, which was applied for by Intel in 2011 and granted in 2015. As written in the corresponding abstract at the bottom right, this technology identifies idle processes among the processes executed in the computer processors, combines them, and reduces the power used by these idle processes.
FIGURE 3.
EXAMPLE OF A DATA-PROCESSING-RELATED TECHNOLOGY (G06F) APPLIED TO A TECHNOLOGY FOR REDUCING POWER CONSUMPTION BY ICTS
Technologies that can help reduce the electricity use of ICT products, such as computer-related products, not only greatly help mitigate climate change but also help expedite the digital transformation by lowering the energy cost of firms. Also, as shown in the previous regression analysis results, the development of such digital technology facilitates the development of climate technology. To summarize, technologies for reducing power consumption levels by ICTs represent a solution to the worrying issues of increasing energy consumption and higher GHG emissions levels induced by the digital transformation. Also, through the development of technologies capable of reducing power consumption by ICTs, we can potentially increase the net energy reduction through the digital transformation process while also helping climate technologies to advance. Thus, if we can explicitly support the development of technologies that reduce power consumption by ICTs through climate policies, not only will this also help reduce climate change, but it will have a positive effect on the digital transformation.
B. Policies for removing factors that could hamper investment incentives for digital technology
Although climate policies are uniformly applied to all areas to accomplish GHG emission goals overall, we can redesign these policies so that we can apply different measures, such as lowering the restrictions or slowing down the policy implementations for areas where we expect to see a rapid reduction of GHG emissions in an innovative way in near future due to, for instance, technological development. By doing so, although we may not be able to meet our short-term goal, we can achieve a larger GHG emission reduction in the mid to long term. As technology-related investments are sensitively affected by the expected returns, regulations in general harm firms’ technological development incentives by lowering the expected return from an investment. Samsung, for example, is said to be facing difficulties in fulfilling its RE100 goal due to an increase in electricity use caused by the production of semiconductors with new technologies, local renewable energy prices, and supply issues. 13 Although participating in the RE100 initiative is thus far voluntary (i.e., although participation is in part due to market pressure, it is not enforced by the government), it is clear that this type of new friction can impact investment returns. This arises because the power supply problem negatively affects semiconductor production and lowers profits by increasing the unit production cost, which in turn lowers expected returns from investments in technological developments. Importantly, however, semiconductors produced using new technologies can do the same tasks using considerably less electricity compared to the existing types, as briefly explained previously. Thus, technological developments in the semiconductor industry can play an important role in significantly improving the net GHG emission reduction effect of the digital transformation.
Continuing the example of semiconductors, firms in this industry always make their mid to long-run roadmaps for technological developments available to the public and attempt to accomplish their innovations accordingly. Thus, it is easy for us to evaluate mid to long-run improvements in the power efficiency and reductions of GHG emissions in this industry compared to those in other industries. By comparing the evaluated expected GHG emissions reduction from using one unit of new semiconductor (where the evaluation takes into account inter-generational technological development spillovers that could arise due to the sequentiality of innovation) with the GHG emissions from producing one unit of new semiconductor, we could adjust the strength of climate policy enforcement in this industry based on the net GHG emissions reduction level. For other digital technologies, we could guide firms to make their technological development roadmaps available to the public so that we could similarly adjust the strength of climate policy enforcement. Thus, we will be able to expedite the GHG reduction speed at the national level if we confirm other cases similar to those in the semiconductor industry and design detailed policies so that we can promote the development of products and technologies related to energy consumption reductions by adjusting the speed of the green transformation (low-carbon transformation) for production facilities. Also, proper government support for producing the products necessary for the digital transformation, such as semiconductors, would greatly help with the digital transformation. However, these relaxations of regulation should be done while traditional environmental regulations, such as those pertaining to wastewater management, are strictly enforced.
Finally, we could consider policies that support the production and development of products that can lower the electricity consumption of consumer electronics, that is, policies that directly support the development and production of low-power consumption products in general. The Korean government currently indirectly supports the development and production of highly energy-efficient consumer electronics by encouraging the demand for such products through an expenditure subsidy program for top-rated energy-efficient products. However, there is no policy of direct support for such products. The reason for considering direct support for the development and production of highly energy-efficient consumer electronics is ultimately to reduce the time and effort required to accomplish carbon neutrality by reducing the level of electricity production through the use of fossil fuels as the total amount of electricity used could be reduced by reducing the electricity used by each product.
Identical to the semiconductor case, we can measure the energy reduction rates of new products (degree of reduction for energy use compared to existing products) by using the level of electricity use for each product, which is a measure currently used for computing the energy efficiency rating. Furthermore, by using this energy reduction rate of new products, we can also compute how much the GHG emissions are reduced due to the development and production of new products. Then, based on this measure, we could fine-tune the timing and degree of climate policies imposed on each firm. Also, for firms planning to use renewable energies, we could provide benefits such as prioritizing renewable energy use or could provide subsidies based on firms’ energy reduction rates of new products. These types of detailed policy support are not possible only through conventional demand-based indirect support. We will be able to expedite the carbon reduction speed at the national level if we can increase the production and demand for products that consume relatively less power.
VI. Conclusion
With regression analyses using the USPTO’s patent database, I find in this paper that developments in various digital technologies, especially technologies related to data processing and machine learning, help development in climate technology. Thus, we need a discussion that includes policies for inducing developments in technologies that could serve as bases for developments in climate technology as an aspect of climate policies. For example, although technologies such as microfabrication processes and technology for the efficient use of energy will become more important, the development and production of products using such technologies could be environmentally unfriendly in the short to medium term. In such cases, we could relax the environmental regulation applied to firms proportional to the positive effect their new products will have on the environment. This will help us gradually transit to an environmentally friendly production process without hindering technological development. Also, we must consider finding important technologies that could serve as bases for developments in climate technology and include these technologies in the existing policies on carbon-neutrality-related investment subsidization. Because developments and improvements in digital technology are already the goals of policies for the digital transformation, simply coordinating this goal with climate policy could help us achieve both the digital transformation and climate change mitigation sooner. In contrast, whether slowing down the digital transformation and developments in digital technology could help achieve our climate change mitigation goals remains unclear, as I could not find any evidence that climate technology can affect development in digital technology, and many existing studies show that digital technology can play an important role in climate change mitigation in the mid to long term.
Appendices
APPENDIX
B. Robustness Check
TABLE B1
EFFECTS OF A DIGITAL TECHNOLOGY SHOCK ON CLIMATE TECHNOLOGY (𝑠 = 0,1,2)
Note: 1) Statistical significance levels: ***p<0.01, **p<0.05, *p<0.1; 2) Standard errors in parentheses.
TABLE B2
EFFECTS OF A FUTURE DIGITAL TECHNOLOGY SHOCK ON CLIMATE TECHNOLOGY (𝑠 = 1,2)
Note: 1) Statistical significance levels: ***p<0.01, **p<0.05, *p<0.1; 2) Standard errors in parentheses.
TABLE B3
EFFECTS OF A DIGITAL TECHNOLOGY SHOCK ON TECHNOLOGY COMBINING CLIMATE AND DIGITAL TECHNOLOGY
Note: 1) Statistical significance levels: ***p<0.01, **p<0.05, *p<0.1; 2) Standard errors in parentheses.
TABLE B4
EFFECTS OF A DIGITAL TECHNOLOGY SHOCK ON CLIMATE TECHNOLOGY, EXCLUDING TECHNOLOGY COMBINING CLIMATE AND DIGITAL TECHNOLOGY
Note: 1) Statistical significance levels: ***p<0.01, **p<0.05, *p<0.1; 2) Standard errors in parentheses.
TABLE B5
EFFECTS OF A DIGITAL TECHNOLOGY SHOCK ON CLIMATE TECHNOLOGY, DIRECTLY USING THE NUMBER OF PATENTS FOR DIGITAL TECHNOLOGY AND CLIMATE TECHNOLOGY
Note: 1) Statistical significance levels: ***p<0.01, **p<0.05, *p<0.1; 2) Standard errors in parentheses.
TABLE B6
ROBUSTNESS TEST FOR EXTENDED REGRESSION ANALYSIS I
Note: 1) Statistical significance levels: ***p<0.01, **p<0.05, *p<0.1; 2) Standard errors in parentheses.
TABLE B7
ROBUSTNESS TEST FOR EXTENDED REGRESSION ANALYSIS II-I
Note: 1) Statistical significance levels: ***p<0.01, **p<0.05, *p<0.1; 2) Standard errors in parentheses.
TABLE B8
ROBUSTNESS TEST FOR EXTENDED REGRESSION ANALYSIS II-II
Note: 1) Statistical significance levels: ***p<0.01, **p<0.05, *p<0.1; 2) Standard errors in parentheses.
Notes
This paper is written based on Jo (2023, forthcoming). I thank two anonymous referees for their valuable comments. Minsu Song provided excellent research assistance. All remaining errors are mine.
The literature on the effect of climate change on the economy is extensive. Nordhaus (2019) can be a good starting point to follow this literature. Han et al. (2021) is a good example documenting various studies and policies related to the digital transformation. Kim and Kim (2020) documents climate policies implemented abroad, including in the EU. Also, Jang et al. (2020) compares the EU’s Green Deal and Korea’s Green New Deal
According to IEA (2022), electricity used by data centers amounts to approximately 0.9-1.3% of the total electricity used worldwide in 2021, and data centers contribute about 0.6% of the energy-related greenhouse gas emissions. Also, the demand for digital services has been increasing rapidly.
According to Samsung, for example, their three nano-fabrication processes achieve a 23% performance increase and a 45% power consumption reduction compared to their prior fabrication process (https://bit.ly/3R0isXQ).
European Union Committee, “Digitalisation for the benefit of the environment: Council approves conclusions,” press announcement, 2020. 12. 17 (https://www.consilium.europa.eu/en/press/press-releases/2020/12/17/digitalisation-for-the-benefit-of-the-environment-council-approves-conclusions/).
I download and use the March 29, 2022 version of PatentsView’s bulk download service for the USPTO patent database. PatentsView (www.patentsview.org) is owned and maintained by the USPTO.
Henceforth, I will use the term patent as an ultimately granted patent application. Also, the year corresponding to any measures constructed using the patents are the year the patent applications are filed.
Henceforth, the terms number of citations, number of forward citations, and number of patents refer to this technology-year mean-adjusted number of forward citations received.
I also ran the same analyses for other detailed digital technologies, but I couldn’t find any statistically significant results in those cases. Thus, the results for these other technologies are not reported to save space. These detailed digital technologies include image and video recognition technologies, counting technologies, and computing technologies.
The remaining two climate technologies are Technologies for Adaptation to Climate Change (Y02A) and Climate Change Mitigation Technologies Related to Wastewater Treatment or Waste Management (Y02W).
Google DeepMind, “Deep Mind AI Reduces Google Data Centre Cooling Bill by 40%,” 2016. 7. 20 (https://www.deepmind.com/blog/deepmind-ai-reduces-google-data-centre-cooling-bill-by-40).
Forbes, “These Are the Startups Applying AI To Tackle Climate Change,” 2021. 6. 20 (https://www.forbes.com/sites/robtoews/2021/06/20/these-are-the-startups-applying-ai-to-tackle-climate-change/?sh=4926ee727b26).
Chosun Biz, “Enormous Power Consumption of Semiconductor’s EUV Process... RE100 Joined Samsung in Trouble,” 2022. 9. 20 (https://biz.chosun.com/it-science/ict/2022/09/20/CTXMIP6IRJBQNJB5F3FTP2JRJI/).
References
Chosun Biz. Chosun Biz, Enormous Power Consumption of Semiconductor’s EUV Process... RE100 Joined Samsung in Trouble, 2022, Sep., 20, https://biz.chosun.com/it-science/ict/2022/09/20/CTXMIP6IRJBQNJB5F3FTP2JRJI/.
European Commission, Directorate-General for Energy, , & (2020). Benchmarking smart metering deployment in the EU-28: Final Report, Publications Office, https://doi.org/10.2833/492070.
Forbes. Forbes, These Are the Startups Applying AI To Tackle Climate Change, 2021, Jun., 20, https://www.forbes.com/sites/robtoews/2021/06/20/these-are-the-startups-applying-ai-to-tackle-climate-change/?sh=4926ee727b26.
Google DeepMind. Google DeepMind, Deep Mind AI Reduces Google Data Centre Cooling Bill by 40%, 2016, July, 20, https://www.deepmind.com/blog/deepmind-ai-reduces-google-data-centre-cooling-bill-by-40.
IEA. IEA, Data Centres and Data Transmission Networks, IEA, Paris, 2022, https://www.iea.org/reports/data-centres-and-data-transmission-networks.
, , , , & . (2018). A Study on the Competitive Analysis of Digital Healthcare in Korea through Patent Analysis. Journal of Digital Convergence, 16(9), 229-237, https://doi.org/10.14400/JDC.2018.16.9.229.
, , , , & . (2020). Recalibrating global data center energy-use estimates. Science, 367(6481), 984-986, https://doi.org/10.1126/science.aba3758.
. (2019). Climate change: The ultimate challenge for economics. American Economic Review, 109(6), 1991-2014, https://doi.org/10.1257/aer.109.6.1991.
OECD. (2020). OECD Digital Economy Outlook 2020. Paris: OECD Publishing. https://doi.org/10.1787/bb167041-en.
Samsung Newsroom. Samsung Newsroom, 2022, Jun., 30, https://bit.ly/3R0isXQ.
Satelite Imaging Corportaion. Satelite Imaging Corportaion, https://www.satimagingcorp.com/applications/environmental-impact-studies/global-warming/.
, & . (2022). Technology shocks and stock returns: A long-term perspective. Journal of Empirical Finance, 68, 67-83, https://doi.org/10.1016/j.jempfin.2022.06.002.
, , , , & (2012). A new EPO classification scheme for climate change mitigation technologies. World Patent Information, 34(2), 106-111, https://doi.org/10.1016/j.wpi.2011.12.004.