- P-ISSN 2586-2995
- E-ISSN 2586-4130

Growth of the Korean economy has been sluggish, and this situation is more pronounced in the service sector. We argue that capital misallocation, especially in the service sector, could contribute to this slowdown. Utilizing firm and sectoral level data, first we assess the rising dispersion of the marginal revenue product of capital (MRPK) driven by the service sector. This could represent a widening misallocation of capital. Furthermore, a panel regression shows that within-sector misallocations at the sectoral level are closely correlated with the lower growth rate of sectoral real value added. Again, this is mainly observed in the service sector, but not in the manufacturing sector. Misallocations of other resources, labor and the intermediate inputs do not stand out.
Resource Misallocation, Firm-level Data, Sectoral Growth
D24, O40, O41, O49
Prosperity and the growth of the aggregate economy are unarguably among the oldest and most important topics in macroeconomics. Efficiency in resource allocation and properly functioning production mechanisms are crucial to any system of macroeconomics. As the Korean economy has passed through various stages of development, the overall growth rate has been reduced, and this is natural from the perspective of growth convergence. As one economy passes through the middle-income stage and enters the advanced group, the growth rate would gradually be reduced. However, it has not been thoroughly examined as to whether production resources are optimally allocated or whether there is any room for improvement in the Korean economy. Although misallocation is a common usual suspect of hampered growth, it is only recent that detailed documentation of misallocation in the Korean economy has been reported. Also, the importance of the service sector has been overlooked and no rigorous assessments exist thus far.
In this paper, we fill this gap and attempt to examine how this distribution of factors of production can affect the overall productivity of the Korean economy. While doing so, we also focus on the service sector and assess how it differs from its counterpart in the economy, i.e., the manufacturing sector. First, through the lens of firm-level data, we examine how the efficiency of resource allocation in the Korean economy has changed over the period of 2000 to 2018. We measure the dispersion of the marginal revenue product of production resources, i.e., capital, labor, and the intermediate inputs, and we assess potential misallocations of production factors in the aggregate economy.
We focus on the service sector for the following reasons. First, it is widely documented that the growth rate of the Korean economy has gradually slowed. More importantly, the downward trend is most notable in the service sector. In Figure 1, the relative level of production per capita for the aggregate economy, that for manufacturing, and that for service are plotted. If we anchor the level of output at the year 2000 (log scale=100), then the level of aggregate per capita output reaches the level of 148 by 2018. However, service sector output reaches only the level of 123, while manufacturing sector output reaches level 187. Although the growth rate of the manufacturing sector, which is the slope of the log output, has fluctuated more in the manufacturing sector, it is observable that the average growth rate and the marginal growth rate at the end of our sample period are far above those of the service sector. International evidence also has demonstrated that the service sector is much more vulnerable to misallocations. It is widely documented that in the run-up to the Euro crisis or the Great Financial Crisis, the service sector was the main driver of the sluggish GDP growth in southern European countries. Institutional friction such as downward wage rigidity, which is known to be stronger in the service sector, has also been posited as the main driver of the sub-optimal adjustment of the macro-economy during the crisis. Motivated by this international and local evidence, the service sector is worth a thorough examination in terms of misallocations.
Note: Author’s calculations based on OECD STAN data. Each series plots the log of value added per employment engaged. All series are anchored at 100 in 2000. Aggregate output is the value added of all sectors. Service output includes every sector except Agriculture, Mining, and Manufacturing.
Our empirical results document the pattern of resource misallocation utilizing firm-level data. We incorporate nationally representative firm-level data and assess the dispersion of the marginal revenue product of capital, labor, and intermediate inputs (MRPK, MRPL, and MRPM, respectively). We calculate value added divided by each production resource after deflating those firm-level variables with sectoral deflators. Among others, the dispersion of MRPK has been widening notably. The dispersions of MRPL and MRPM improved when compared to 2000, while that of MRPK deteriorated. Furthermore, this trend is mostly driven by the service sector. The increasing dispersion of MRPK in the service sector is clearly observed throughout the entire sample period, i.e., from 2000 to 2018. We also note that the variations in the dispersion of MRPK depend on the size of the firm. We show that inefficiencies in capital allocations are predominant in firms with a small number of workers. We believe that this suggests that capital misallocation is a critical factor behind the growth slowdown of the Korean economy.
At the same time, we also show that these misallocations at the sectoral level are tightly correlated with the (realized) growth of real value added. Moreover, the service sector strongly contributed to this pattern. We run a fixed-effect panel regression in which we regress 26 sectoral misallocations on sectoral value added growth. If the lagged standard deviation of MRPK rises by one percent, the growth of real value added tends to decrease by 1.1 percentage point. These results are statistically significant. If we further control for the time trend and use a crisis dummy for the Global Financial Crisis, the results still hold. Thus, the correlation between the dispersion of MRPK and the growth of realized value added does not merely come from a confounding factor of a time trend; rather, it partly stems from cross-sectional covariations. Again, the result is mostly driven by the service sector. If we split our sample and run the sectoral regression independently, the results are preserved in the sample of the service sector, but not in the manufacturing sector. If the lagged standard deviation of MRPK rises by one percent, the growth of real value added also tends to decrease by 1.1 percentage point in the sample of the service sector. However, this result does not hold in the manufacturing sector. Not only are the signs of the regression preserved, but we also lose all statistical significance. These are interesting new stylized facts. Moreover, rising dispersions of MRPK in the aggregate service sector do not necessarily predict these patterns. Our second results indicate that on average, there is a much tighter correlation between the MRPK dispersions and the hampered real value added growth in the service sector. Within-group dispersions at the 26-sectoral level are meaningfully associated with realized value added growth. This is a different approach from those in the literature in the sense that we incorporate realized values of sectoral output.
Our results are derived from firm-level data. Researchers also tend to utilize plant-level data and thus only focus on the manufacturing sector. However, misallocations in the service sector are much severe than those in the manufacturing sector. This is widely documented in the literature. At the same time, it could also be more important to assess resource misallocation at the firm level instead of at the plant level, depending on the intent or scope of the question. Whether it is important to focus on firm-level data or plant-level data is self-evident. For one, a central question would be whether to observe variation at the plant level, which uses rather a homogenous technology. Then, researchers could find results that are relatively free from the issue of heterogeneity in production technology. However, the weak performance of the service sector in the Korean economy is of great importance and an immediate issue at hand. To the best of our knowledge, our work is the first to assess misallocations at the firm level in Korea covering not only listed and audited firms but virtually every firm for which data are available.
It is natural to mention that there are a few shortcomings in our approach. As for all other studies that deal with misallocations, measurement error could be a critical factor; it may also be more severe for the small firms in the service sector. We complement our analysis as much as possible and provide exhaustive results for robustness. It is also important to note that our work is mute with regard to the source(s) of these dispersions. Heterogeneity in production technology could be an essential factor that drives the dispersion of MRPK. Given that we are covering the service sector using firm-level data, heterogeneity in production technology could be the factor that generates the significant fraction in the dispersion of MRPK. That is, it is possible that the heterogeneity in production technology could be much more severe in the service sector. Our results need to be interpreted carefully. In such a case, the high dispersion of MRPK does not necessarily imply capital misallocation. Nonetheless, however, we believe that our work is meaningful in relation to several ways. First even if the dispersion of MRPK could partly stem from the heterogeneity of production technologies among firms, its steady rise entirely due to rising heterogeneity in technology would be less probable. Furthermore, it is not likely that rising dispersion is mainly due to the rising heterogeneity in production technology. It would also be not very likely that these outcomes are further correlated with the growth of sectoral value added. Our work does not attempt to identify causality and does not address the sources of these potential misallocations. We still believe that our work provides invaluable empirical evidence which connects the dispersion of capital allocations and sectoral value added as long as readers fully understand its limitations.
In summary, we argue that the misallocation of capital, but not the misallocation of labor or intermediates inputs, matters. These findings have important policy implications. Our results provide strong evidence that financial intermediation for the service sector, possibly aiming at the domestic market, faces more distorted friction than that in the manufacturing and/or export sectors. Thus, we claim that friction in financial intermediation should be prioritized during institutional reforms. Alternatively, any policy that aims to affect the service sector should be evaluated from the perspective of macroeconomic resource allocation and should be assessed as to whether it has affected resource misallocation. Although these sources of misallocation and policy-related issues are important, our work is mute on those. We believe that these issues are beyond the scope of our paper, and we will leave them to future researchers. In the next chapter we introduce literature relevant to this study and describe how our work stems from or is distinguished from previous works.
Our work is related to several strands in the literature. First, there is a vast amount of literature regarding the misallocation of resources, especially capital misallocations. Most notably, Hsieh and Klenow (2009) measure the resource misallocation and argue that the differences in economic performances between China, India and the US economy can be explained significantly in terms of efficiency losses from capital allocations. Utilizing plant-level data, they measure the marginal revenue product of capital (MRPK) and the marginal revenue product of labor (MRPL). Our methodology that measures misallocations is in principle identical to their canonical methodology, except that we exploit intermediate inputs and gross output instead of value added as was done in Hsieh and Klenow (2009). Also, we exploit firm-level data such that we can focus on the dynamic variations of misallocations of resources. Their work is clearly seminal, and much research has followed. Although the intuition that resource misallocation could be a potentially critical factor accounting for GDP growth, they were among the first to document the idea in a systematic manner.
In a similar vein, Restuccia and Rogerson (2008) build a theoretical model that suggests a framework by which to understand how differences in resource allocation among different establishments can account for differences in production among different countries. As in Hsieh and Klenow (2009), these authors also provide a counterfactual analysis arguing that reallocating resources to the most efficient level, even without any other technological progress, could contribute to increase total factor productivity by 30 to 50 percent. Recently in Restuccia and Rogerson (2017), the authors further review certain strands in the literature and conclude that misallocation matters in practice and could account for significant output losses. Also, it could account for cross-country differences in the levels of output. However, the sources of allocation vary and are fiercely debated.1
Thus far, the literature has explained the within-industry dispersion of the resources. Oberfield (2013), in contrast, stressed the importance of between-industry misallocation. He extends Hsieh and Klenow (2009) and provides a methodology with which to disentangle misallocations into within-industry and between-industry types. Then, armed with Chilean manufacturing establishment data, he argues that the latter matters more in accounting for the total factor productivity declines during the 1982 financial crisis.
It should also be noted that capital misallocation in southern European countries has been at the forefront of economic debate there. Gopinath et al. (2017) document that capital misallocation has widened since the commencement of the Euro system, noting that this situation is more eminent in Spain, Portugal, and other southern European countries. Empirically, they incorporate firm-level data, as we do, and claim that capital inflows triggered by adopting the Euro have been the main driver of capital misallocations. Along with size-dependent financial friction, these inflows are allocated not to the most efficient firms but to larger firms with lower productivity. They show that this is essentially one of the most critical factors in accounting for the low performance outcomes of the Euro system. Capital flows also matter for resource reallocation out of the manufacturing sector in general. Benigno and Fornaro (2015) incorporate a panel of 70 countries from 1990 to 2014, showing that large capital inflows are associated with labor reallocation to the non-manufacturing sectors. However, they do not incorporate the dispersions of marginal product revenue.
The closest documentation to ours is Dias et al. (2016; 2019), who utilize Portuguese firm-level data, including service firms, and claim that allocative efficiency deteriorated leading up to the Euro crisis. They also incorporate a three-factor production model and argue that within-industry misallocations doubled from 1996 to 2011. Similar to Gopinath et al. (2017), they conduct a counterfactual analysis and conclude that the allocation of resources at the most efficient level would increase the level of GDP by 79%. We mostly apply this canonical methodology when measuring the dispersions of production factors in Korea, confirming that the service sector matters as well.
Our work is distinguished from previous work in several ways. Instead of calculating counterfactual efficiency gains from the reallocation of production resources to the most efficient firms within the industry, we provide the correlation between the realized growth of sectoral value added and MRPK misallocation. We apply sectoral regression and highlight the contribution of the service sector. We argue that this is an interesting exercise in the sense that misallocations could account for an important fraction of the sluggish economy ex post. Although many studies have conducted counterfactual exercises to account for reallocative gains, our work focuses on documenting regression results out of the 26 aforementioned sectors. Choi (2021) shows that capital misallocation is correlated with aggregate GDP growth for a panel of ten countries from 2002 to 2017, but not at the sectoral level.
There also has been recent documentation stepping further from the canonical methodology. David and Venkateswaran (2019) suggest a methodology to account for sources of capital misallocation. They categorize technological or informational types of friction, such as adjustment costs, uncertainty, technological or markup heterogeneity. They conclude that adjustment costs explain a significant fraction of misallocation in large US firms, but not in China. On the other hand, Bils et al. (2021) stressed the importance of measurement errors. They exploit the dimension that if measurement error exists, the dynamic correlation between revenue growth and input growth could be loose. Based on their newly developed methodology, they also conclude that measurement errors matter more in relation to the accounting misallocations of the US than they do for those of India. For the US, these errors could account for most of the increases in revenue per input (TFPR) dispersion. Baqaee and Farhi (2020) present a general equilibrium framework which provides a nonparametric methodology to measure inefficiencies from misallocation or markup dispersions. Through the lens of their model, they argue that reallocations of resources to firms with greater markup would increase the overall productivity (TFP) by 15% for the US. An article by Liu et al. (2021) also claims that state-owned enterprises (SOEs) combined with interest rate liberalization could lead to misallocations. Analyzing a Chinese case with a distorted financial system, the policy indeed has hampered the allocative efficiency and lowered aggregate productivity.
Moving our interests to the Korean economy, many scholars have pointed out the sluggish growth over the last several decades. Kim et al. (2018) report a gradual decrease of the GDP growth rate and argue that it is more likely a long-run trend instead of a cyclical downturn. According to the author, the average growth rates of real GDP for the decades of 1981 to 1990, 1991 to 2000, 2001 to 2010, and 2011 to 2017 have been 9.9%, 7.0%, 4.4%, and 3.0%, respectively. Also and more interestingly, residuals after accounting for aggregate labor and capital allocated to the production have gradually decreased from 3.7%, 2.0%, 1.7%, and 0.7%, respectively. The author notes that sluggish growth rates were also reported in many other countries after the Global Financial Crisis. Also, he notes the possibility that external demand could be a critical factor behind this decrease. However, allocative efficiency measured by MRPK dispersion has not been covered. Here, instead, we argue that deteriorating allocative efficiency from the service sector could be an essential element to account for sluggish growth rates.2
Regarding misallocation in the Korean economy, Kim, Oh, and Shin (2017) present one of several works to deal with the efficiency of resource allocation. Applying the canonical methodology of Hsieh and Klenow (2009), the authors analyze the efficiency of capital allocation in the Korean economy from 1982 to 2007. With establishment-level data from the manufacturing sector, they conclude that the efficiency of capital allocation in the Korean economy as a whole increased before 1992 but has continued to deteriorate since then. They further assert that the downward trend in capital allocation until 2007 continues to be observed even after the global financial crisis.
Results from Cho (2017) are also worth mentioning. He argues that this decrease in the growth rate is due to inefficient capital allocation by certain business groups. Through the dynamic Olley-Pakes decomposition proposed by Melitz and Polanec (2015), he shows that the covariance between productivities and shares decreased. Based on these new findings, he concludes that the efficiency of capital allocation decreases. More importantly, their findings suggest that such inefficiencies in capital allocation are manifested by companies belonging to the corporate group. We do not focus on the corporate group, rather focusing on the manufacturing versus service sector. Complementing earlier works, our work contributes to the rationale of the sluggish growth rate and potential inefficiencies in the Korean economy.
The remainder of this paper proceeds as follows. In Chapter III, we describe the data used to calculate the dispersions of MRPK, MRPL, and MRPM and look at the various dispersions by year and by industry. Chapter IV provides our main empirical results related to misallocation and sectoral economic growth. Chapter V concludes the paper.
In this section, we describe the methodology to estimate marginal revenue productivity. Our methodology is based on Dias et al. (2016) and Gopinath et al. (2017), which extends the model of Hsieh and Klenow (2009).
The production of individual firms in each industry is aggregated into total industrial output by CES production technology. Here, s is the subscript for industry, t is the time series, and Dist is the demand shock of individual firms. As in earlier studies, ε is the elasticity of substitution. In addition, it is assumed that the production of individual firms combines labor, capital and intermediate inputs,3
A firm’s output is given by a Cobb-Douglas production function where Aist , kist , list , and mist denote firm i ’s total factor productivity (TFP), capital stock, labor and intermediate inputs, respectively. Individual firms maximize their profits and choose their price, capital, labor and intermediate inputs,
Here, πist denotes the profit of an individual firm belonging to industry s , p(yist) is the inverse demand function of the individual firm’s product, Rst is the market interest rate and the depreciation, and Wst is the market wage in the industry.  ,
,  , and
, and  are wedges for the total output, total capital, and total labor, respectively. These
wedges are exogenous, and we assume they cause the prices of the factors of production
faced by an individual firm marginally different from those of other individual firms.
are wedges for the total output, total capital, and total labor, respectively. These
wedges are exogenous, and we assume they cause the prices of the factors of production
faced by an individual firm marginally different from those of other individual firms.
The nominal value added of an individual firm would be its total nominal production (pist yist), which is the value of the firm’s operating revenue minus the material cost, wage bill and direct labor cost on the firm’s financial statements. In addition, as in Gopinath et al. (2017), the monopoly market price of each individual firm is replaced with the price at the second level (two-digit level) of ISIC Rev2. Labor (list) is the sum of the wage bill on the income statement and labor costs and welfare costs on the statement of the costs of goods manufactured.4 Capital (kist) of an individual firm uses the price discounted for fixed assets, which includes both tangible and intangible fixed assets. We used OECD STAN deflators from 2000 to 2018 and incorporate the industry classification of ISIC Rev 2.
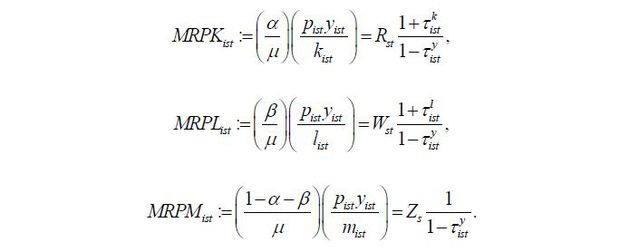
The first-order condition for the profit maximization problem of the above firm can be summarized as follows,
Here, μ = ε/(ε-1) is the mark-up applied to the marginal cost. As in Gopinath et al. (2017), this is assumed to be fixed at 1.5 in all industries. From the above equation, we note that it is the optimal choice for an individual firm to invest capital until the marginal revenue product of capital (MRPK) reaches the real interest rate, depreciation (Rst), and the wedge. In order to estimate the dispersions of MRPK, MRPL, and MRPM, we calculate the dispersion of the firm’s marginal product by industry and then aggregate with the weighted average.5
In this section, first we describe the data, after which we calculate the marginal revenue productivity of the production factors. Utilizing the methodology presented in the previous section, we then show the dispersions of the production resources and consequent various facets of the empirical results. We utilize financial statements and industry factor shares. The firm-level data are from Korea Investor Service (KIS DATA). The data provide detailed information about each firm’s balance sheets, income statements and the cost of the manufactured goods. The data cover various types of firms, both listed firms and SMEs, and we utilize virtually all firm data available. Thus, we believe that the dataset represents the largest of its type available for our purposes, making it suitable to construct nationally representative data and analyze consequent production factor misallocations.
From the dataset, we obtain information about a firm’s gross output, capital stock (tangible fixed assets and intangible fixed assets), labor costs (wage bill, direct labor cost and other employee benefits), intermediate consumption (material cost), number of employees and variables for the value added calculation. Although these data are available from 1975, we confine ourselves from 2000 to 2018 to focus on recent periods and to ensure consistent industry classifications with OECD STAN data. Missing observations and errors are removed. In order to use the deflator of OECD STAN, we match the KSIC (Korea Standard Industry Code) and ISIC (International Standard Industrial Classification). After several steps, we have our final dataset with 459,021 observations.
For the industry-level factor shares, we utilize the values from Dias et al. (2016). Similar to Dias et al. (2016), our analysis cannot identify the input distortions (average wedges) and the input elasticities in each industry. As an alternative, we incorporate U.S. data; for the U.S. economy, there is relatively little distortion, and using this data can be a simple way to control the problem caused by distortion. We use the average factor shares of the U.S. during the period of 1998 to 2010, as published by the BEA (Bureau of Economic Analysis). The U.S. economy between 1998 and 2010, the factor share of labor compensation (=Compensation of employees / Gross output) is approximately 33% and the consumption of intermediate inputs (=Intermediate inputs / Gross output) is about 46%.6
Table 1 shows the summary statistics for each industry classification in this study. There are 345,248 manufacturing firms, representing approximately 75% of the sample. In manufacturing, Machinery and equipment n.e.c. (CK) had the highest number of observations at 71,535. Among the services, Construction (F) had the highest number at 82,330. Although the difference isn’t large, sales and material costs tend to be higher in manufacturing. However, with the exception of the industries Electricity, gas and water supply; sewerage, waste management and remediation activities (D-E); Transportation and storage (H); and Financial and insurance activities (K), which show high values on average, most service industries have higher labor costs and lower material costs than those of the manufacturing industries.
Source: KIS DATA from the Korea Investor Service, OECD STAN. Units of capital and labor are both denominated in mil KRW. Observations include all year-firm observations during the sample period.
For a preliminary examination, we assess the dispersion of MRPK for individual industries at the 2-digit level of ISIC Rev2. First, we compare the MRPK dispersion from 2000 to 2002 and the dispersion from 2016 to 2018. In the top figure in Figure 2, we find that the levels of dispersion for the service industry are higher than those of the manufacturing sector; the service industry is mostly distributed in the right tail. However, the levels of dispersion in the service sector are even further escalated; in a sample from 2016 to 2018, the overall composition of the dispersions is further polarized, and we can observe that dispersion in the service industry increased. Even in these simple snapshots, a widening misallocation of capital is already evident.
Source: Author’s calculations based on KIS DATA.
Next, instead of showing snapshots of the two different periods, we provide misallocations for each production factor over time. Figure 3 shows the changes in marginal revenue productivity dispersions according to different sectors.
Source: Author’s calculations based on KIS DATA.
It should be noted that we anchor our series at the year 2000 and plot the dispersions of MRPK, MRPL and MRPM. First, we find that the dispersion of MRPK shows a rising trend over the sample periods. Although the dispersion of MRPK had been widening (and thus inefficiency has been dwindling) up to 2008, it increased sharply after that date. It shows an increase during the financial crisis and up to 2016. On the other hand, MRPL and MRPM showed steady improvements after 2000.
Most importantly, we stress that the trend is mostly driven by the service sector. We divide our sample into the manufacturing and service sectors and further examine the changes in the dispersions of MRPK, MRPL, and MRPM over time.7 First, manufacturing shows relatively little variation in the dispersions of the production factors. On the other hand, for the service sector, the dispersion of MRPK significantly rises over the sample period. Relative to the misallocation anchored at 1 in the year 2000, the dispersion of MRPK reached approximately 1.3 by 2018. This is quite stark compared to the dispersion of ln MRPK within the band between 0.9 and 1.1 in the manufacturing sector. Also, while the potential misallocation of the manufacturing sector shows some fluctuations around the anchor, those of the service sector show a rapidly increasing trend from 2003 onward. Overall, the rising trend of inefficiencies are mostly notable for capital, while those of labor and intermediate inputs are rather mild or even in a decreasing trend.
It is also important to note that the simultaneous increase or decrease of the dispersions of MRPK, MRPL and MRPM may be driven by co-movements with mark-ups. In particular, in the period where MRPK, MRPL, and MRPM decreased simultaneously (from 2002 to 2007), it is not feasible to identify whether those that drive the downward trends of all three series are mark-ups or not. However, we can see a clear pattern of a rising MRPK dispersion after 2008. The dispersion of MRPK, which steadily increases even in a situation where MRPL and MRPM decrease, appears to be independent of any mark-up, and this may be a situation in which the inefficiency of production factor allocation increases.
Now, we change gears and further document an important factor pertaining to the widening misallocation. Figure 4 shows the bilateral relationship between the dispersion of MRPK and log employment. Here, as in Figure 2, we take snapshots of the periods of 2000 to 2002 and 2016 and 2018. Also, we divide our aggregate results further into manufacturing and services. Several interesting results stand out. First, as in the previous figures, the overall dispersions of MRPK are more pronounced in the service sector. When comparing the dispersions of the manufacturing and the service sectors, we can confirm that the dispersions of MRPK in the service sector are much larger regardless of the employment size. These results hold for both the 2000 to 2002 and for the 2016 to 2018 samples.
Note: The black lines are the average dispersion of MRPK for 2000-2002 and for 2016-2018 by industry in the corresponding images.
Source: Author’s calculations based on KIS DATA.
Secondly, while a firm with more employee shows small dispersion and spread outcomes, the gap widens in 2016 to 2018. Again, this phenomenon is more prominent in the comparison between the manufacturing and service industries. For the manufacturing industry, the averages of the dispersion and variations between 2000 to 2002 and 2016 to 2018 did not show much of a difference, whereas in the service industry, the MRPK dispersion increased significantly, and the spread of the dispersion also increased. It is readily apparent that the average dispersion of MRPK in the service sector in the sample 2016 to 2018 is higher than that in the sample of 2000 to 2002.
Full-blown time series data of the misallocations between small and large firms are depicted in Figure 5. Here, we split the sample according to firm size (small firms and large firms) and sectors. The firm size was defined as ‘small firm’ on the left side for those with fewer than 50 workers and ‘large firm’ on the right side for those with more than 50 workers. From Figure 5, we also claim that small firms are the main driver of the widening capital misallocation. Again, capital misallocation is much more severe for service firms. Capital misallocations in service firms are clearly in a rising trend for most of the sample periods. However, those of large service firms fluctuate instead and do not show a clear pattern. In the manufacturing sector, the difference between small and large firms is also evident. However, capital misallocation does not severely deteriorate and is maintained under level 1.1. Interestingly, misallocations of intermediate inputs matter much more in large manufacturing firms.
Source: Author’s calculations based on KIS DATA.
To wrap up, we argue that the size of the firm matters when attempting to explain misallocations. While the deterioration of MRPK dispersion is mainly noticeable for small firms, the inefficiency of labor and intermediate inputs is intensifying for large firms. We argue that capital misallocations are widening and are mostly driven by small service firms.
Thus far, we have documented the trend of the marginal revenue product of capital (MRPK), that of labor (MRPL), and that of intermediate goods (MRPM). There is a clear pattern of rising dispersions of MRPK, and the trend is mainly driven by the service sector. Our evidence implies that there exists a widening of misallocation mainly coming from the service sector, which could also be found in other international episodes. That is, the service sector matters and is responsible for the aggregate efficiency losses. In this chapter, we change gears again and assess the relationship between resource misallocation and economic growth through a panel regression. More specifically, we construct a panel of real value added growth and the dispersions of production resources at the sectoral level. As in the previous sections, within-group dispersions of marginal revenue products are measured at four-digit level and are aggregated by the weight of nominal value added. For the sectoral data of nominal value added, the deflator, and the employment engaged number are from OECD STAN data. Our data span the period of 2000 to 2018. We exclude the most recent years due to the data availability issue. Because our focus is on tranquil periods, the years after Covid-19 should be dropped anyway and we restrict our sample up to 2018. To construct real value added growth, we deflate nominal value added by sectoral deflators. As in the previous section, we have 26 sectors (10 manufacturing, 14 services, and 2 others). We focus on manufacturing and service and do not report results for agriculture and mining, as the shares of value added and employment to overall output for the sector are not significant. Details of the data construction process and the title of each sector can be found in the appendix.
Our empirical specification is as follows;
where s and t stand for sector and time respectively. yt stands for sectoral value added and Zt includes further controls such as crisis dummies for 2008 and 2009, and time and time squared terms. We include a lagged level of value added to control for growth convergence. The crisis dummy captures growth rate hampering due to external crisis shocks, and time dummy captures the time trends. The squared term is included to capture possible reversions and the consequent hump shapes of the growth rates.
Through the empirical specification, we could assess whether realized value added is statistically correlated with resource misallocation. Although widening dispersions of marginal revenue product of resources will in principle lead to efficiency losses, few attempts have been made to conduct a panel analysis. The lack of work at the country level is mostly due to a lack of data availability. If one wants to examine whether misallocations account for significant fraction of the overall realized growth rate, one needs to incorporate firm- or plant-level data from multiple economies. Here, our task is more narrowly focused on the service sector. Thus, we assess whether or not the service sector matters with a panel of 26 sectoral levels. Even if our setup is relatively simple, it yields solid results and informs us clearly that on average, within-capital allocation matters for growth on average.
Our baseline results are reported in Table 2. Here, we run a fixed-effect panel regression for all 26 sectors, initially noting that the lagged level of log real value added shows a strong convergence pattern; as the previous level of output is high, the current growth rate will be lower. These outcomes capture the convergence of economic growth, which is the standard in growth accounting regressions.
Note: 1) *, **, and *** indicate significance at the 10%, 5%, and 1% levels, respectively; 2) MRPK, MRPL, and MRPM represent the log value of the marginal revenue product of capital, labor and the intermediate inputs divided by a hundred, respectively; 3) Time and Time squared terms are included; 4) Lagged ln (real VA) is included to control for the convergence of the growth rate; 5) A sector fixed effect is included.
More importantly, we show that the statistical significance of the lagged standard deviation of MRPK stands out. That is, as the dispersion of MRPK increases, the growth rate of sectoral real value added tends to decrease; if the lagged standard deviation of MRPK rises by a single percent, growth of real value added tends to decrease by 1.04 percentage points without any further controls (column (1)). Moreover, if we add an indicator for the crisis period and possible time trend, the coefficients become larger. In column (3), if the lagged standard deviation of MRPK rises by one percent, the growth of real value added tends to decrease by 1.1 percentage points.
It is equally interesting that the other two production resources show few statistically meaningful results. The increases in the lagged standard deviations of MRPL are positively correlated with sectoral real value added growth. This is counterintuitive in the sense that the possible misallocation of labor is correlated with higher sectoral value added growth. However, the coefficients feature no statistical significance, making it difficult to interpret the results. For the intermediate inputs, there is essentially no contribution to growth.
Lastly, in column (4), we add the growth of employment as an additional control measure. That is, we add the log difference of employment engaged for each sector. Readers can now interpret the value added growth as a per-capita term. The increase in employment is correlated with higher economic growth, implying that the growth of aggregate employment allocated partly contribute to economic growth. Interestingly, the coefficient of the dispersion of MRPK becomes smaller. At this point, if the lagged standard deviation of MRPK rises by one percent, the growth of real value added tends to decrease by 0.78 percentage points. Even when adding employment growth as a control factor, our overall messages are preserved. The coefficients of the dispersion of MRPL and MRPM do not show any statistically meaningful results.
It is also important to note that for our baseline regression covering all sectors, the time trend does not show any meaningful results. Finally, the indicators for the Global Financial Crisis period show a strong negative impact on sectoral value added growth, as expected.
Now, we move on to the next stage and focus on the manufacturing or service sector independently. We split our sample and redo the regression but for the manufacturing sample and for the service sector sample independently. In Table 3, we report our results for the manufacturing sector. Most notably, we find that the statistically meaningful coefficient for the dispersion of MRPK has disappeared throughout all specifications. Not only does the statistical significance disappear, the signs of the coefficients change or fluctuate significantly over different specifications. These results suggest that the outcomes of the baseline regression (Table 2) do not stem from the manufacturing sector. Moreover, our baseline message of a tight correlation between capital misallocation and sectoral economic growth is not preserved.
Note: 1) *, **, and *** indicate significance at the 10%, 5%, and 1% levels, respectively; 2) MRPK, MRPL, and MRPM represent the log value of the marginal revenue product of capital, labor and the intermediate inputs divided by a hundred, respectively; 3) Time and Time squared terms are included; 4) Lagged ln (real VA) is included to control for the convergence of the growth rate; 5) A sector fixed effect is included.
Contrary to the results in the manufacturing sector, the results from the service sector sample are consistent. In Table 4, the coefficients of the dispersion of MRPK are all negative and statistically significant. Without any control but with the convergence term, if the lagged standard deviation of MRPK rises by one percent, the growth of real value added tends to decrease by 0.81 percentage points (column (1)). As we add the further controls of the indicator of the Global Financial Crisis and the time trend, the coefficients increase and more statistical significance becomes evident. In column (3), if the lagged standard deviation of MRPK rises by a single percent, the growth of real value added tends to decrease by 1.11 percentage points. As in our baseline results for all sectors, no other coefficients of the dispersions of production factors are statistically meaningful. It is also interesting to note that labor growth does not play an important role in shaping the growth rate. Typically, the labor share for the service sector increases over the development path, while that of the manufacturing sector has a hump-shaped pattern. Bergin et al. (2022) document that the pattern is evident for East Asian countries and that Korea is not an exception. Here, we also claim that labor reallocation does not play an essential role in shaping the within-sector allocative efficiency outcomes. While it is likely to result in more labor in the service sector, it is virtually muted with regard to shaping how much capital each firm receives and how capital misallocation worsens.
Note: 1) *, **, and *** indicate significance at the 10%, 5%, and 1% levels, respectively; 2) MRPK, MRPL, and MRPM represent the log value of the marginal revenue product of capital, labor and the intermediate inputs divided by a hundred, respectively; 3) Time and Time squared terms are included; 4) Lagged ln (real VA) is included to control for the convergence of the growth rate; 5) A sector fixed effect is included.
It is also important to note that without a time trend, the growth of the manufacturing sector is closely related to the dispersion of MRPL. In columns (1) and (2) of Table 3, the coefficients of the dispersion of MRPL are very large and are also statistically significant. However, once we control for the time trends, the statistically meaningful results are all erased. The negative correlations between the lagged standard deviation of MRPL and the growth rates are greatly lower, not showing, however, any statistical significance. It is likely that the dispersions of MRPL are correlated with the time trends or there is a confounding factor that affects the dispersion of MRPL and the increasing pattern of output growth simultaneously.
Again, careful interpretation is needed when considering the results. If the dispersion of the marginal product of capital rises consistently over time, it is likely that the allocative efficiency deteriorates. In principle, those deteriorating misallocations should contribute negatively to the growth of output. However, the rising trend of the dispersion itself does not necessarily imply a tight correlation between realized growth and misallocation at the sectoral level. Thus, here we argue that the service sector matters in the sense that on average, resource misallocation affects the growth of output ex post, and this is more clearly observed in the service sector.
Our results provide several policy implications. First, we note that the overall atmosphere towards the service sector had changed in last couple of decades. The government has launched various measures to strengthen the competitiveness of the service industry. Two policy directions were declared: to revise any regulations restricting competition and to establish an institutional basis for fostering the service industry. It has long been argued that industrial policies were biased towards the manufacturing sector. Since 2000, the government has attempted to revise the environment deemed as only favorable to the manufacturing and to implement policies that support start-ups and provide tax favors to service firms. Furthermore, by expanding the coverage of industries subject to financial support from the manufacturing industry to all industries, service firms also enjoyed a more favorable loanable fund market. In addition, regulations in the service industry such as those related to tourism, culture, and entertainment were alleviated. Since then, “Service-PROGRESS” was implemented to advance the service industry in 2008, and various policies have been implemented and supported thus far to create jobs and improve productivity through service innovations.
We conjecture that the more favorable atmosphere implemented by the government could be a possible trigger for the growing inefficiencies in the service sector. However, here we do not provide any meaningful correlation with such policies, leaving this work for future researchers.
The Korean economy has suffered from a slowdown of growth recently. At the same time, relatively low performance in the service sector has been widely noted. In this paper, we assess the probability of capital misallocations as measured by the dispersion of the marginal revenue product of capital, being an essential factor in accounting for the recent hampered growth rate. We claim that the service sector matters after all. We document a strong correlation between capital misallocation and the growth rate, especially in the service sector. Utilizing firm- and sectoral-level data from 2000 to 2018, we show that the dispersion of the marginal revenue product of capital (MRPK) has been clearly in a rising trend in the service sector. This could represent a widening misallocation of capital. The pattern is not as clearly observed for the other two factors of the production resources, labor and intermediate goods. Capital misallocation, as in other economies such as those in southern European countries leading up to the Euro crisis, matters, especially for the service sector.
Furthermore, we conduct a panel regression analyses and show that within-sector misallocations at the sectoral level are correlated with the realized lower growth rate of sectoral real value added. This is mainly observed in the service sector, but not in the manufacturing sector. Capital misallocation shows a widening trend over time. For the average service sector, ex-post realized real value added may stem from the widening capital misallocation. Misallocations of other resources, labor and the intermediate input do not stand out.
Measurement errors may also be important, meaning that readers should interpret our results with care. Also, we note that heterogeneity in production technology in the service sector could also be a factor when deriving the dispersion of MRPK. However, we nonetheless argue that it is not very likely that heterogeneity in production is in a rising trend and that it thus shapes our overall message. It is also unlikely that the tight correlation between the growth rate and the dispersion of MRPK is attributed to varying heterogeneity in production technology. It is also difficult to imagine that measurement errors are evolving in a systematic manner such that they strengthen the role of the service sector.
Our results imply that correcting distortions or friction in terms of capital intermediation should be assigned higher priority on the policy to-do list. Any allocative friction associated with capital effective in the service sector should be carefully assessed from the perspective of aggregate efficiency. Regarding the source of the widening capital misallocation, this study remains silent, and we thus call for future research in this area.
For the dispersions of the MRPK, MRPL, and MRPM calculations, the data were extracted from financial information (KIS DATA) provided by the Korea Investor Service. We utilize balance sheets, income statements, and the statements of the costs of goods manufactured. The following steps are implemented to establish the data, particularly the capital stock, labor costs, intermediate inputs, and value added.
First, capital stock is calculated as the sum of tangible fixed assets and intangible fixed assets and is dropped if missing or if the sum of the two variables is negative. We also drop the observation when the ratio of tangible fixed assets to total assets exceeds one. Labor costs use the wage bill on the income statement and labor and welfare expenses on the statement of the costs of goods manufactured. The observations are dropped if the wage bill, labor cost, and welfare cost are negative or missing. Similarly, intermediate inputs use material costs on the statement of the costs of goods manufactured, and missing or negative observations are dropped. Value added is calculated as the value of the firm’s operating revenue minus the material costs and direct labor costs. Direct labor costs include miscellaneous allowances, bonuses, and provisions for severance indemnities and are dropped if missing or negative.
In addition, observations with clear errors are removed, including negative liabilities, a negative number of workers, and a number of workers exceeding 1,500,000 (one observation). We calculate the standard deviation based on the four digits of ISIC Rev. 2, which may include too few observations for certain industries. Certain cases are excluded from the analysis if the possibility arises that they may overestimate or underestimate the representation of a specific industry. ‘Manufacture of tobacco products;’ ‘Water collection, treatment and supply;’ ‘Postal and courier activities;’ and ‘Libraries, archives, museums and other cultural activities’ are excluded.
In this section, we examine the impact of entries and exits on the dispersions of MRPK, MRPL, and MRPM. First, the analysis period is extended from 1993 to 2021 to define a “survived firm,” referring to a firm that has survived for more than ten years. Subsequently, the dispersions of MRPK, MRPL, and MRPM are calculated by industry and year with the same methodology used in the main text. We thus have 314,619 final observations.
The aggregate shows a trend similar to that of the total sample but with a lower dispersion. Likewise, the same phenomenon is observed in the manufacturing and service sectors. In contrast, after 2016 it appears that the inefficiency of production factors improved compared to 2000. However, the dispersion of MRPK is still high in the service industry, and the inefficiency of capital in the service sector is considered to be an issue that exists even after considering entries and exits.
Here, we plot the unconditional series of growth of real value added and dispersion of MRPK for the 26 sectors. Again, the dispersion of MRPK is measured by the standard deviation of the log of MRPK. Sector [O] was dropped due to incomplete observations. Although the identification of the relationship between the growth of real value added and the dispersion of MRPK will come not only from the time-series dimension but also from the cross-sectional dimension, we believe that it is informative to document individual series. Figures A2 to A5 show the results. First, we note that a rising trend of the widening dispersion can be observed. The dash line gradually increases in most cases in the sector. This trend is most clear in the Construction, and Information and Communication sectors. These two sectors feature steadily rising trends for most of the sample periods. After 2010, Accommodation and Food Services Activities also shows a similar trend. Considering the weight of these sectors in the overall economy, it is not surprising that the aggregate trend of the service sector shows a clear upward trend. We can also find an upward rising trend in several manufacturing sectors, notably Transport Equipment.
Note: In all cases, the solid line is the growth of real value added per employment engaged. The dash line is the log of the dispersion of MRPK.
Note: In all cases, the solid line is the growth of real value added per employment engaged. The dash line is the log of the dispersion of MRPK.
Note: In all cases, the solid line is the growth of real value added per employment engaged. The dash line is the log of the dispersion of MRPK.
Note: In all cases, the solid line is the growth of real value added per employment engaged. The dash line is the log of the dispersion of MRPK.
Next, we examine whether the negative correlation between value-added growth and the capital misallocation stands out. Several sectors show clear and negative co-movement between two series: Real Estate Activities and Administration and Support Service Activities. Though this is not our main focus, it is notable that Mining and Quarrying shows clear negative correlation. For construction, although it shows a clear pattern of rising dispersions of MRPK, it is difficult to conclude that value added growth features a downward trend.
In Tables A1 and A2, we also report single sector regressions. Again, the identification of a correlation between the dispersion of MRPK and sectoral real value added growth comes from the cross-sectional variation. However, it is also somewhat apparent that the coefficients of the dispersion of MRPK are mostly negative. For the manufacturing sector, it shows larger swings of the coefficients among different subsectors.8 On the other hand, the service sector shows smaller swings, but on average the values of coefficients tend to be negative. Again, readers should read the results with care, as these regressions only incorporate a single series.
Note: 1) *, **, and *** indicate significance at the 10%, 5%, and 1% levels, respectively; 2) MRPK, MRPL, and MRPM represent the log value of the marginal revenue product of capital, labor and the intermediate inputs divided by a hundred, respectively; 3) Time and Time squared terms are included; 4) Lagged ln (real VA) is included to control for the convergence of the growth rate; 5) A sector fixed effect is included.
Note: 1) *, **, and *** indicate significance at the 10%, 5%, and 1% levels, respectively; 2) MRPK, MRPL, and MRPM represent the log value of the marginal revenue product of capital, labor and the intermediate inputs divided by a hundred, respectively; 3) Time and Time squared terms are included; 4) Lagged ln (real VA) is included to control for the convergence of the growth rate; 5) A sector fixed effect is included.
Part of the paper is based on Woo Jin Choi, 2021, External Capital Accounts and Macroeconomics: Capital Flows and Aggregate Productivity, Policy Study 2020-16, KDI (in Korean).
Please also check Banerjee and Moll (2010), Moll (2014), Buera and Shin (2013) for the extended rationale pertaining to the sources of misallocation.
Bergin, Choi, and Pyun (2022) show that different growth rates between the manufacturing and non-manufacturing sectors can be attributed to the capital account policy, which combines reserves and capital controls.
Jones (2011) emphasizes the importance of intermediate inputs in the production function, as intermediate inputs are very similar to capital. Intermediate inputs can be put in quickly relative to capital and can be fully depreciated. However, as capital takes a comparatively long time to be invested, it is partially depreciated. Therefore, from a long-term and short-term perspective, intermediate inputs and capital are essentially identical to the factors of production.
In South Korea, the labor cost and welfare cost on the statement of the costs of goods manufactured changed from a mandatory disclosure to a voluntary disclosure in 2004. In other words, observations since 2004 only apply to firms that voluntarily disclosed the statement of the costs manufactured.
Because this is calculated using the four-digit method of ISIC Rev. 2 to maintain the variation of each observation, different weights are applied for each industry (four digit) and year (2000~2018). We also exclude extreme values by dropping observations that are below 0.1 percentile and above 99.9 percentile levels.
We calculated the factor share from 2000 to 2018 for robustness of the analysis. For the U.S. economy between 2000 and 2018, the factor share of labor compensation (= Compensation of employees/Gross output) is approximately 30% and the consumption of intermediate inputs (= Intermediate inputs/Gross output) is about 44%. However, because the factor share of each input is not significantly different, the value from Dias et al. (2016) was used as is.
Foster et al. (2008) emphasized the important mechanisms of “entry and exit” to improve aggregate productivity. The mechanism seeks to reallocate market share to more efficient firms through entries and exits. We confirmed the effectiveness of the entry and exit strategy from the analysis, and the details are described in the appendix.
, & . (2010). Why does misallocation persist? American Economic Journal: Macroeconomics, 2(1), 189-206, https://doi.org/10.1257/mac.2.1.189.
, & . (2020). Productivity and misallocation in general equilibrium. The Quarterly Journal of Economics, 135(1), 105-163, https://doi.org/10.1093/qje/qjz030.
, & . (2015). Large Capital Inflows, Sectoral Allocation, and Economic Performance. Journal of International Money and Finance, 55, 60-87, https://doi.org/10.1016/j.jimonfin.2015.02.015.
, , & . (2021). Misallocation or mismeasurement? Journal of Monetary Economics, 124, S39-S56, https://doi.org/10.1016/j.jmoneco.2021.09.004.
, & . (2013). Financial frictions and the persistence of history: A quantitative exploration. Journal of Political Economy, 121(2), 221-272, https://doi.org/10.1086/670271.
, & . (2019). The sources of capital misallocation. American Economic Review, 109(7), 2531-2567, https://doi.org/10.1257/aer.20180336.
, , & . (2016). Misallocation and Productivity in the Lead up to the Eurozone Crisis. Journal of Macroeconomics, 49, 46-70, https://doi.org/10.1016/j.jmacro.2016.04.009.
, , & . (2008). Reallocation, firm turnover, and efficiency: Selection on productivity or profitability? American Economic Review, 98(1), 394-425, https://doi.org/10.1257/aer.98.1.394.
, , , & . (2017). Capital Allocation and Productivity in South Europe. Quarterly Journal of Economic, 132(4), 1915-1967, https://doi.org/10.1093/qje/qjx024.
, & (2009). Misallocation and manufacturing TFP in China and India. The Quarterly journal of economics, 124(4), 1403-1448, https://doi.org/10.1162/qjec.2009.124.4.1403.
, & . (2015). Dynamic Olley-Pakes productivity decomposition with entry and exit. The Rand Journal of Economics, 46(2), 362-375, https://doi.org/10.1111/1756-2171.12088.
. (2014). Productivity losses from financial frictions: Can self-financing undo capital misallocation? American Economic Review, 104(10), 3186-3221, https://doi.org/10.1257/aer.104.10.3186.
. (2013). Productivity and misallocation during a crisis: Evidence from the Chilean crisis of 1982. Review of Economic Dynamics, 16(1), 100-119, https://doi.org/10.1016/j.red.2012.10.005.
, & . (2008). Policy Distortions and Aggregate Productivity with Heterogeneous Establishments. Review of Economic Dynamics, 11(4), 707-720, https://doi.org/10.1016/j.red.2008.05.002.
, & . (2017). The Causes and Costs of Misallocation. Journal of Economic Perspectives, 31(3), 151-174, https://doi.org/10.1257/jep.31.3.151.