
Franchise Market, Contract Conditions, and Welfare Implications: Evidence from Korea†
Abstract
This paper analyzes how franchise contract conditions are influenced by business structures as well as how contract conditions affect producer surplus by utilizing Korean franchise Information Disclosure Documents for the years 2014-2016. We find that franchise fees tend to increase in line with increases in the numbers of direct stores or the business period. Accordingly, it would be reasonable to check whether the franchise fee is excessive compared to the amount of reputation capital rather than to criticize the absolute level of the franchise fee. Regarding royalty contracts, the larger the discount in the raw materials purchase is, the higher the initial royalty is. Although this appears to be a royalty discount, it can be a means of inducing a raw materials purchase contract by initially setting a high royalty rate and then lowering it after the purchase contract is signed. Concerning the effect on producer surplus, the results show that an increase in franchise fees and royalties negatively affects the franchisee’s operating profits but positively affects those of the franchisor’s, leading to conflicts over the distribution of economic value added. Based on the findings here, we propose various policy recommendations, specifically reinforcing the contents in the Information Disclosure Document, further activating fixed-rate royalties, and strengthening the qualifications of franchisors when recruiting franchisees.
Keywords
Korean Franchise Market, Franchise Fee, Royalty Rate, Franchise Contract Conditions
JEL Code
D22, L13, L16, L22, L50
I. Introduction
Korea’s franchise market is growing rapidly. From 2014 to 2016, the number of franchisors increased from 3,923 to 4,664, and that of franchisees rose from 208,099 to 230,054. Accordingly, the overall market size of the franchise business grew to 114 trillion won in 2016, an increase of 24.3% compared to 2014.
Such rapid growth was made possible by several business advantages arising from the franchise contractual relationship. First, franchisors can spread their own brands and business models through the recruitment of franchisees, which eventually raise brand value as well as profits. Also, they can acquire various types of market information through local franchisees so as to improve their business strategies. From the franchisees’ perspective, they can easily and quickly start a business while receiving marketable products, learning sales techniques, and gaining management know-how from their franchisors. Furthermore, the tendency of consumers to prefer standardized products in terms of price and quality over relatively non-standardized goods may support the expansion of this market.
However, this rapid growth has been accompanied by various internal conflicts between franchisors and their franchisees. There were 779 applications for dispute mediation in 2017, more than double the 357 filed in 2008. Looking at the types of conflicts, disputes related to information asymmetry account for 30% of the total, and cases caused by the imbalance of bargaining power are also on the rise (Korea Fair Trade Mediation Agency, 2013; 2018).1
Based on this background, this study examines the growth trend and market structure of the domestic franchise market, utilizing brand-level microdata from Information Disclosure Documents.2 Subsequently, we quantify the effect of the market structure on franchise contract conditions and analyze in depth the effects of contract conditions on producer welfare. The empirical findings lead to policy suggestions for improving the franchise market system.
II. Related Literature
This section reviews existing literature, focusing on franchise contract conditions, and identifies the various contributions of this paper.
First, Gallini and Lutz (1992) argue that franchisors use royalty rates as a signal to convey the profitability of their products. A franchisor after developing a highly profitable product sets a high initial royalty rate to signal the quality of the product. As time passes, her brand becomes more recognized and a reputation for product profitability is formed, the incentive for signaling is weakened and the royalty rate therefore gradually decreases, though the franchise fee increases instead.
Mathewson and Winter (1985) finds that franchisors use franchise fees as a means of recovering reputation capital. Their findings through a reputation model imply that a new franchisor sets the franchise fee low due to the low reputation level, later increasing it when the business period is extended and the reputation for brand profitability is established.
These theoretical results pertaining to the volatility of franchise fees and royalties were subsequently verified empirically. Lafontaine (1992) analyzes data from 548 franchisors in the service sector in the US and finds that royalty rates tended to decrease as the number of years in business increased. The franchise fee, however, was not significantly affected by the business period, from which she suggests that the franchise fee and royalty rate do not necessarily have a negative relationship.
Lafontaine and Shaw (1999) examine contract data of one thousand franchisors who were active during 1980-92. In the OLS model, a longer business period was likely to decrease the royalty rate and increase the franchise fee. However, in the fixed-effect model, these tendencies were mostly insignificant.
As such, various opinions exist depending on the data and methodologies, confirming a gap between theory and empirical results. In particular, for the Korean franchise market, even basic data on contract conditions are insufficient, and a relationship between business characteristics and contract conditions has not yet been proven. These conditions serve as the motivation for this study.
Park (2013) focuses on how franchisors adjusted the number of franchisees and directly managed stores, especially when the conditions of the business area change. Analyzing Information Disclosure Documents (as of the second half of 2010) with an ANOVA test, he finds that the rate of increase in the number of franchisees and directly managed stores, whose business areas become unprotected, was higher than that of stores facing the opposite situation. Accordingly, the sales of franchisees in the former situation were lower than those of rate stores in the latter.
When the profit structure of franchisors is excessively dependent on the franchise fee and store opening cost, as in Korea, the market is likely to have increasingly more franchisees, possibly driving the sales of individual stores down. Park (2013) demonstrates that such concerns are emerging in the domestic franchise market. However, the effect of business area protection on the eventual profits of franchisees is debatable. When business area is protected, some part of the franchisee’s income from the exclusive territory may be transferred to the franchisors (in the form of franchise fees or royalty rates), ultimately not contributing to the profits of the franchisee. Our study differs in that it quantifies the business area based on distance, population, and administrative district and uses this new definition in a regression analysis to find how business area protection affects both contract conditions and producer welfare, respectively.
Meanwhile, Klein and Saft (1985) qualitatively discuss essential commodity contracts (tie-in contracts).3 Without a tie-in contract, the free-rider problem may arise in which opportunistic franchisees use cheap and low-quality intermediate goods to secure high profits. If consumer utility is reduced due to quality degradation, it may place a negative externality on the demands of other franchisees using standardized intermediate goods. Thus, they argue that commodity contracts that lower monitoring cost required to ensure product standardization and to prevent the free-ride problem. If so, the distribution margin included in the price of the essential commodity is understood as a reward for maintaining the demand for individual franchisees due to product standardization and the lowering of monitoring costs that must be paid by franchisees in part.
However, there has been strong criticism in the domestic franchise market, pointing out that the distribution margin for raw and subsidiary materials is excessive and related to the inclusion of items irrelevant to quality in the contract. Accordingly, the appropriate level of margin and the range of commodities to be included in the tie-in contract are becoming important issues. However, it is very difficult to obtain objective data necessary to examine these issues. Therefore, this study intends to examine the possibility of and the extent to which the tie-in contract is linked to the royalty contract and the effect it has on the welfare of producers.
III. Structure of the Korean Franchise Market
In this section, we examine the growth trend of the domestic franchise market (in terms of the numbers of franchisors, brands, franchisees, and directly managed stores) and then identify the different characteristics between industries. The data in this section are mainly constructed based on Information Disclosure Documents (2014-2016).
A. Number of Franchisors and Their Brands
According to Figure 1, the number of franchisors increased from 3,923 in 2014 to 4,664 in 2016, as has the number of brands, from 4,843 to 5,741. During this period, both figures increased by 19%, indicating that new franchisors have actively entered the market.
FIGURE 1.
NUMBER OF FRANCHISORS AND BRANDS
Source: Calculated by the author using microdata from Information Disclosure Documents (2014-2016).
Table 1 shows the rise and fall of franchise brands. In 2015 alone, domestic franchisors newly launched 2,224 brands (①+②), and a staggering 47% (1,046) failed to last for more than a year, possibly due to low profitability and failures to recruit new franchisees.
TABLE 1
RISE AND FALL OF FRANCHISE BRANDS
Source: Calculated by the author using microdata from Information Disclosure Documents (2014-2016).
Of the 5,741 active brands in 2016 (②~⑤), only half were older than three years, while those who remained were fairly new (maximum of two years). Nevertheless, the market supply of brands was growing in net terms as new entrants outnumbered exiters.
Regarding the distribution of brands by industry (Figure 2), there were 4,341 (75.6%) in food services, 1,076 (18.7%) in the service sector, and 324 (5.6%) in wholesale and retail businesses out of 5,741 brands in 2016. With food services taking up an overwhelming proportion, about 70% of brand growth from 2015 to 2016 also occurred in this sector.
FIGURE 2.
NUMBER OF BRANDS BY LARGE SECTORS
Source: Calculated by author using microdata from Information Disclosure Documents (2015-2016).
A closer examination reveals that fried chicken (22%), Korean food (Hansik, 18%), and coffee franchises (11%) account for more than 50% of all food services. The concentration on food services is largely dependent on overconcentration in some specific food sectors.
In Korea, the proportion of self-employment is higher than those in other countries with similar economies (Lee, 2020). In addition, establishments are concentrated in a few industries, such as restaurants and accommodation, causing fierce competition among these small business owners (Lee, 2017). These types of industrial concentration and overcrowding are also occurring in the franchise market.
B. Number of Franchisees and Directly Managed Stores
The growth of the franchise market is also evident when examining the number of stores. As shown in Figure 3, franchisees increased from 208,099 in 2014 to 230,054 in 2016, and directly managed stores increased from 15,459 to 17,033 during the same period.
FIGURE 3.
NUMBER OF FRANCHISE STORES AND DIRECTLY MANAGED STORES
Source: Calculated by the author using microdata from Information Disclosure Documents (2014-2016).
A closer look at the number of franchisees in Figure 4 reveals that food services account for 112,533 (48.9%) of the total, followed by the service industry at 68,090 (29.6%) and wholesale and retail trade at 49,431 (21.5%).
FIGURE 4.
NUMBER OF FRANCHISEES AND NUMBER OF FRANCHISE STORES PER BRAND
Source: Calculated by the author using microdata from Information Disclosure Documents (2016).
However, in terms of the number of franchisees under each brand, (the scale of the franchise system), the order is wholesale and retail, services, and food services. This occurs because small-scale franchises are concentrated in food services, whereas wholesale and retail businesses consist of many large-scale and corporate types of franchise systems.4
C. Sales of Franchisees
Total franchisee sales increased from 50.1 trillion won in 2014 to 64.4 trillion won in 2016, and sales per franchise also increased from 286 million won to 325 million won during the same period. Along with more franchisors, brands, and franchisees, the growth in franchisee sales also underpins the quantitative expansion of the market.
At each industry level, total franchisee sales in the food services sector were largest at 30.6 trillion won in 2016, while the wholesale and retail sector earned 27.9 trillion won. Given that the number of franchisees in food services is more than double that in the wholesale and retail sector, the difference between the two appears to be surprisingly small.
Moreover, the growth rate of sales compared to 2015 is highest at 3.9 trillion won in the wholesale and retail sector; hence it is likely that the market size will reverse in the future.
D. Brands without Directly Managed Stores
Table 3 indicates that nearly 60% of brands do not have directly managed stores and rely solely on franchisees. More specifically, this applies to 60.8% in food services, 58.3% in services, and 45.7% in wholesale and retail.
TABLE 3
PERCENTAGES OF BRANDS WITHOUT DIRECTLY MANAGED STORES
Source: Calculated by the author using microdata from Information Disclosure Documents (2016).
Such a practice raises significant concerns because by not running directly managed stores, franchisors may not have the opportunity to gain insight into their products’ competitiveness and learn from trial and error. This, in turn, can negatively impact their franchisee sales through transferred business risks. Indeed, Figure 6 shows that brands without directly managed stores are particularly prevalent in businesses with low sales performance, such as fried chicken, Hansik, and drinking establishments.
FIGURE 6.
PERCENTAGE OF BRANDS WITHOUT DIRECTLY MANAGED STORES (FOOD SERVICES)
Source: Calculated by the author using microdata from Information Disclosure Documents (2014-2016).
Also, according to the correlation analysis, sales are negatively correlated with the number of franchise stores (-0.104) but positively correlated with the number of directly managed stores (+0.345). In other words, the more franchisors are exposed to the market by operating directly managed stores, the more likely franchise sales will increase.
IV. Conditions of the Franchise Agreement
The franchise agreement involves various costs the franchisee has to bear, including the initial costs before the start of the business, the costs incurred when running the business, and several conditions imposed on business activities.
A. Setup Costs (Prior to Opening)
In order to start a franchise store, prospective franchisees pay an average of 117.6 million won to franchisors. The setup costs include the franchise fee (10.1 million won, 8.6%), the training fee and deposit (7.6 million won, 6.5%), the interior fit-out (53.4 million won, 45.4%), and other expenses (46.5 million won, 39.5%), as shown in the panel on the left in Figure 7.
FIGURE 7.
FRANCHISE SETUP COST OVERALL (LEFT) AND BY SECTOR (RIGHT)
Source: Calculated by the author using microdata from Information Disclosure Documents (2016).
Franchisors reap rewards for transferring their accrued brand reputation and management know-how. The franchise fee is a price of using a brand with reputational capital. From the franchisees’ perspectives, they are willing to pay more for reputable brands. Accordingly, rather than criticizing the absolute amount of the franchise fee, it would be more logical to examine whether the high price is justified by the franchisor’s level of experience and expertise.
The interior fit-out of a franchise store accounts for the greatest share of the initial outlay. With regard to this fee, franchisees are often forced into contracts with certain interior design firms designated by the franchisors. This has recently led to some controversy. Of course, franchisors should be able to provide interior blueprints or guidelines in order to maintain consistency of their stores. However, binding contracts to a specific firm may violate Article 12 (Prohibition on Unfair Trade Practices) of the Fair Transactions in Franchise Business Act. Recognizing this, most franchisors accept the franchisee’s choice of contractor. This, however, entails an exorbitant supervision fee.
When the interior cost becomes a common source of revenue for franchisors, this will further incentivize them to open more stores, ultimately damaging the win-win relationship between franchisors and franchisees.
B. Types of Royalties
A royalty payment is a monthly payment made by the franchisee to the franchisor after the opening of the store, and it is another form of remuneration for using the franchisor’s reputational capital and business know-how.
According to the panel at the top of Table 4, the average adoption rate in royalty contracts is 68.3%, which appears to be relatively high figure. However, a fixed-rate royalty (a certain percentage of the franchisee’s sales), which is most suitable due to the nature of royalties and which induces mutual cooperation by linking the profits of franchisors and franchisees, is only used by 25.4% of brands.
TABLE 4
ADOPTION RATE OF ROYALTIES
Note: Because certain brands accept multiple royalty types, the sum of the types does not equal the total.
Source: Calculated by the author using microdata from Information Disclosure Documents (2016).
A fixed-sum royalty is more commonly adopted with 41.8% of brands. Within such a contract, the royalty revenue is fixed regardless of the franchisee’s sales; hence, franchisors are less inclined to support their “progenies” in their efforts to improve their performance.
There are other types of royalty schemes as well. In 2.8% of brands, royalties are set in proportion to the price of raw materials purchased by franchisees or in proportion to the number of facilities or even the furniture in the store.
According to Table 5, royalty rates tend to be quite low in food services, such as the bunsik, Hansik, and fried chicken types, where franchisees are concentrated and sales per store are relatively low. In such overcrowded markets, the survival rate of stores is quite low. Therefore, franchisors may try to secure a one-time initial payment (franchise fee) by recruiting franchisees or may attempt to include the franchisors' margin in the price of the raw materials.
TABLE 5
ROYALTY RATES
Source: Calculated by the author using microdata from Information Disclosure Documents (2016).
FIGURE 8.
NUMBER OF BRANDS PROVIDING ROYALTY DISCOUNTS CONDITIONAL ON RAW MATERIALS PURCHASES
Source: Calculated by the author using microdata from Information Disclosure Documents (2016).
In particular, we found many cases in which the royalty rate was discounted when franchisees purchased raw materials from their franchisors or designated firms. Such cases frequently arose in the food services sector, such as drinking establishments (26 cases), Hansik stores (18 cases), and fried chicken stores (nine cases), where the royalty discount could be in the range of 70-100%. This implies that royalties and raw materials margins are linked and that a royalty discount strategy is used to induce raw materials purchase contracts.
C. Business Area
The business area refers to the range of the commercial area in which franchisees can exclusively operate under the brand. In accordance with the Franchise Business Act (Article 5), all franchisors in Korea must set up a business area for each franchisee and must not open directly managed stores or other franchisee stores within the area.5
As of 2016, approximately 80% of brands had established areas based on distance (radius or walking). The distance scheme is used the most in food services (87%), with the narrowest range (0.69km).
V. Effects of Franchise Market Structures on Contract Conditions
This section analyzes the relationship between the market structure and contract conditions of domestic franchise businesses. First, we explain the main variables and models, after which we estimate models of franchise fees and royalties.
A. Variables and Models
We established a ‘basic database’ with the cooperation of the Korea Fair Trade Mediation Agency. The basic database contains various summary information on all brands in the Information Disclosure Documents (2015-2017). Given that the summary information for each year reflects the situation of the previous year, our basic database contains information from 2014 to 2016.
However, contract terms such as royalties and business areas, which are essential for this study, were missing from the basic database. In order to create these variables, we searched all brands in the basic database on the franchise business website and downloaded the original Information Disclosure Documents.6 Through this work, royalties, business areas, opening dates of directly managed stores, the existence of the regional headquarters, and other factors were extracted and quantified for use in the ensuing quantitative analysis.
In particular, the average franchise fee in Table 7 is 9.8 million won, which is lower than the average of 10.1 million won mentioned in Section 5; in Section 5, the average value was calculated for brands with a positive franchise fee, whereas in the regression analysis in this section, all brands even with a zero franchisee fee were included. In 2016, the total number of brands was 5,741, of which 245 (4.3%) had a franchise fees of zero. This is done to reflect franchisors’ recent strategy of not charging franchise fees in the fierce competition to recruit franchisees.
In the regression analysis, only data from 2015-2016 were used, with data from 2014 excluded. This was done because the key variables in this study (industry, business start date, number of franchisees, number of directly managed stores, franchise fees, royalties, business area, etc.) do not exist in the 2014 data. The final dataset used consists of 48% of 2015 brands and 52% of 2016 brands.
The estimation model is as follows:

The dependent variable yijst is the contract terms (franchise fee, fixed-sum or fixed-rate royalty) of brand i with its franchisor located in region s , in industry j and in year t . For example, it can be the franchise fee for the restaurant brand J&M Chicken located in Seoul in 2016.
The independent variable Xijst includes various franchise characteristics according to the model. At the brand level, it includes the number of stores, the number of directly managed stores, the number of regions where directly managed stores exist, the number of franchisees, and the duration of the franchise business. These characteristics are closely related to the size of the franchise system as well as to brand awareness and can thus affect the reputation capital of the brand. In addition, various types of business areas are controlled as operating conditions faced by franchisees.
Meanwhile, at the level of the establishment (trade name), the number of brands owned is included in Xijst. When a single franchisor operates multiple brands, not only the brand reputation but also the franchisor's reputation can be formed. Specifically, the franchisor’s reputation may have a common influence on each brand or may induce interactions between brands. For this reason, it must be controlled in the model. In addition, the number of employees, advertising expenses, promotional expenses, and the number of violations of the law are controlled.
Ij is an industry dummy controlling the fixed effect by industry at the level of a middle or large sector. Ds is a regional dummy, set at the metropolitan city level. Tt is a year dummy, representing year-by-year economic fluctuations, and finally uijst is an error term that satisfies the IID condition. If uijst satisfies the IID assumption, it means that the unobserved characteristics of different brands are independently extracted from an identical distribution, which is a rather strong assumption. Other estimation methods can be explored if more abundant data exist, but for now, we have controlled sector, region, and year as measures that can contribute to satisfying the IID assumption.
As an estimation method, we basically use the Ordinary Least Square approach considering the structure of pooled data, but also use instrumental variable estimations under the potential endogeneity of a few variables.
B. Estimation Results: Franchise Fee Model
Table 8 reports the influence of various market and business characteristics on the level of the franchise fee. According to model (1), when the number of directly managed stores and the period of the franchise business increase by one unit, the franchise fee significantly increases by 13.8 and 33.4 thousand won, respectively.
T ABLE 8
ESTIMATION RESULTS OF THE FRANCHISE FEE MODEL (1)
Note: Standard errors are in parentheses. *, **, and *** denote statistical significance at the 10%, 5%, and 1% level, respectively.
This implies that franchisors transfer their business know-how acquired from operating directly managed stores and franchise businesses to the franchisees and receive a franchise fee in return. Meanwhile, a negative coefficient appears in the squared term of the franchise business period, indicating that the rate of increase is gradually slowing down.
The number of brands owned by the franchisor also has a significant impact, with the franchise fee increasing by 211 thousand won as one more brand is added. When operating multiple brands, awareness of the franchisor can be increased and various trials and errors of the franchisor can have a positive impact on the reputation capital of each brand. These results are consistent with Mathewson and Winter (1985), who suggest that the franchise fee can be set high as the brand reputation capital accumulates.
On the other hand, as the number of franchisee stores increases, the franchise fee tends to decrease. However, this appears less convincing because an increase in the number of franchisees can also be positive, increasing brand awareness and accumulating reputation capital.
Models (2) to (4) control for factors related fluctuations in the number of franchisees. Interestingly, as the number of contract terminations or cancellations of franchisees increases, the franchise fee significantly decreases. Contract terminations and cancellations can negatively affect the brand reputation capital by lowering the reliability and degrading the cooperative relationship between the two parties, possibly becoming a direct reason for the suspension of new contracts. At the same time, the number of franchisees, which previously showed a negative sign, no longer shows a significant effect in models (2) to (4). Considering a highly positive and significant correlation between the number of franchisees, the number of contract terminations and cancellations,7 the negative effect previously shown appears to have been induced by the effect of contract terminations and cancellations.
In addition, models (1) to (3) show that the franchise fee is likely to decrease as the number of brands per total sales and the number of brands within a sector increase. This outcome supports the franchisor's strategy of lowering the franchise fee amid the competition to recruit franchisees.8 Model (4) controls for year dummies and industry dummies, measured at the large classification level. Recalling that the food services sector has significantly more brands than others, it is possible for the negative effect of the number of brands within a sector to be included in the fixed effect of the industry.
In order to verify the robustness of the above results, we examine various models, as shown in Table 9. Model (5) includes 44 middle-class industry dummies to control for fixed effect by sector. As a result, key results pertaining to the number of directly managed stores, the period of the franchise business, the number of franchisor’s brands, and the number of franchisees are maintained.
TABLE 9
ESTIMATION RESULTS OF THE FRANCHISE FEE MODEL (1)
Note: Standard errors are in parentheses. *, **, and *** denote statistical significance at the 10%, 5%, and 1% level, respectively.
In model (6), the number of stores, the ratio of directly managed stores, and the number of regions in which directly managed stores exist are controlled for, instead of the number of directly managed stores and franchisees. While the number of stores is insignificant, the ratio of directly managed stores and the number of regions with directly managed stores have significantly positive effects. This reaffirms that the experience of running directly managed stores is an important factor with regard to the accumulation of brand reputation capital.
Meanwhile, the possibility that the franchise fee can affect the number of franchisees needs to be checked. If prospective franchise founders prefer brands with low franchise fees, an endogeneity problem arises in relation to the number of franchisees. Also, if a certain brand has a reputation for being highly profitable, this increases the franchise fee and makes it easier to recruit franchisees; accordingly, the number of franchisee stores may be vulnerable to the endogeneity problem due to simultaneity.9,10 Therefore, model (7) considers previous values of the variables, but it shows no significant differences from the previous results.11
In Model (8), we estimate the equation using only the observations with the business area set. These results show that as the distance range of the business area increases by 1km, the franchise fee tends to increase by 71.5 thousand won. As the scope of the exclusive commercial district widens, the survival probability of a franchisee may increase. When uncertainties regarding business stability are reduced, it will be easier for franchisors to recover their reputation capital at the time of the contract.
C. Estimation Results: Royalty Model
According to the literature, royalties tend to decrease as the period of the franchise business becomes longer. Therefore, it is necessary to examine whether such a relationship exists in the domestic franchise industry as well.
Looking at models (1) and (2), where the fixed-sum type of royalty is a dependent variable, the royalty tends to increase as the number of directly managed stores increases. This suggests that the fixed-sum royalty is being utilized as a tool similar to a franchise fee. A franchisor would like to receive all of the compensation for reputational capital when signing a franchise contract, but it is impossible to recover all in such cases due to uncertainty about the future. Accordingly, they are likely to receive a fixed-sum royalty during the business period as a complement.
TABLE 10
ESTIMATION RESULTS OF THE ROYALTY MODEL
Note: Standard errors are in parentheses. *, **, and *** denote statistical significance at the 10%, 5%, and 1% level, respectively.
In models (3) and (4), in which the fixed-rate royalty is set as the dependent variable, a significant positive effect is found in the number of brands, while the number of directly managed stores and the franchise business period became insignificant.
Another interesting point is that as the number of franchisees increases, the fixed-rate royalty tends to increase. If there are more franchisees in the market, competition intensifies, which may reduce the sales of individual franchisees as well as the royalty income of franchisors. Accordingly, the franchisor has an incentive to cover the reduced income by increasing the royalty rate. This interpretation is consistent with Rubin (1978)’s argument that, when the market is saturated, franchisees earn less in sales and thus franchisors increase royalties.
We knew cases in which royalties were discounted conditional on the purchasing of raw materials from franchisors or designated firms. Considering this, models (1) to (4) include the degree of the royalty reduction. These results show that both fixed-sum and fixed-rate royalties tend to be set significantly higher as the royalty reduction is larger. This suggests that franchisors adopt a strategy of setting royalties high initially and then lowering them after the signing of a purchase contract. They can secure profits by including a margin in the price of the raw materials, and a royalty discount strategy can be introduced to induce purchase contracts.
VI. Effects of Contract Conditions on Producer Welfare
At this stage, we proceed to discuss to effect of franchise contract terms on business performance outcomes and provide implications on how these effects are related to conflicts between two parties over the distribution of value added.
A. Merging Contract Condition Variables into MDIS
Tackling this issue requires additional data about the business performance outcomes of franchisors and franchisees. Accordingly, we construct the data from the Microdata Integrated Service (MDIS) of wholesale and retail surveys as well as from service industry surveys of Statistics Korea. The MDIS dataset contains a wealth of information on sales and operating profits and various characteristics of individual firms. Using MDIS data, we can distinguish franchise and non-franchise businesses and identify franchisors and franchisees.
Specifically, the contract condition variables from the Information Disclosure Documents are merged into MDIS at the five-digit level of the standard industrial classification (KSIC). Table 11 shows summary statistics of the wholesale and retail surveys and the service industry surveys used for the analysis.
TABLE 11
SUMMARY STATISTICS OF RETAIL DATA
Note: Regular business holidays indicate one day of the month, two represent two to three days of the month, three indicates four to five days of the month, four indicates six to seven days of the month, and five indicates eight or more days of the month.
Source: Microdata on franchise disclosure documents (2014, 2016), Wholesale and Retail Trade Survey MDIS (2014, 2016), Service Industry Survey MDIS (2014, 2016).
B. Effects of Contract Conditions on the Sales of Franchisees
Examining model (1) in Table 12, the sales of franchisees tend to increase as the ratio of directly managed stores and the period of the franchise business increase. Specifically, a 1%p increase in the ratio of directly managed stores and one more month of the franchise business are likely to raise sales by 1.47 and 0.78 million won, respectively. It is possible that reputation capital contributes to attracting consumers and thus increases the demand for individual franchisees. Also, rich business know-how passed down from franchisors may have raised franchisees' sales.
TABLE 12
ESTIMATION RESULTS OF FRANCHISEES’ SALES
Note: Standard errors are in parentheses. *, **, and *** denote statistical significance at the 10%, 5%, and 1% level, respectively.
In addition, as the number of stores increases, franchisee sales tend to decrease. An increase in the number of stores can help increase sales by improving brand awareness, whereas fierce competition among stores may lead to a decrease in the sales of an individual franchisee. The results suggest that the latter effect is greater.
Regarding the effect of protecting the business area, the sales of franchisees are significantly higher when the established business area is the walking, vehicle, or population type. When the scope of the business area increases by 1km for the walking or vehicle distance, sales tend to increase by 114.4 million won and 57.9 million won, respectively; if the population within the business area increases by 1,000, sales are likely to rise by 1.2 million won.
In models (2) to (4), the franchise fee and various types of royalty variables are set as independent variables. Regarding these models, it should be noted that if reputation capital-related variables are set as independent variables at the same level as franchise fees and royalties, endogeneity problems may arise in these contract condition variables. In addition, the effect of reputation capital is dispersed into direct effects through the ratio of directly managed stores and the period of the franchise business and indirect effects through franchise fees and royalties, causing the difficulties in interpretation. Therefore, in Models (2) to (4), the reputation capital variables are set as instrumental variables of franchise fees and royalties, respectively.
The estimates in Models (2) and (4) suggest a tendency for franchisees' sales to increase significantly when the franchise fee increases. A positive coefficient is also estimated in Model (3), but it is not significant.
On the other hand, royalty contracts show different results by type. The fixed-sum royalty in Model (2) does not have a significant effect. In such a contract, a fixed amount of money is collected every month regardless of the level of franchisees’ sales, meaning that a franchisor’s incentive for raising their stores’ sales may be low. Conversely, the fixed-rate royalty contract of Model (3) shows a significant positive effect. When the royalty increases by 1%p, the franchisees’ sales increase by approximately 4.4 million won on average, supporting the contention that franchisors can have a strong incentive to increase their stores’ sales.
Model (4) considers another type of royalty, corresponding to a certain percentage of the raw materials price. Having negative coefficients, this type of royalty is commonly observed in wholesale and retail and in food services. In a situation where new franchisors who have not accumulated reputation capital cannot set high franchise fees and royalties, they may try to secure profits by including margins in the raw materials price. However, as brand awareness and the reputation are insignificant, it appears to be difficult to generate the effect of increasing demand for franchisees.
C. Effects of Contract Conditions on Franchisees’ Operating Profits
The effect of increasing sales from franchise fees and fixed-rate royalty contracts appears to be good for franchisees. Nevertheless, setting them high may not be necessarily beneficial to their welfare because franchise fees and royalties are what they eventually have to pay to franchisors. If the effect of increasing costs is greater than the effect of increasing sales, the operating profit that franchisees can secure will actually decrease. In particular, considering the industry criticism that the costs paid by franchisees to the franchisor are excessive and cause management instability, verification of this aspect is very important.
Indeed, it is found that increases in franchise fees and all types of royalties have a negative effect on operating profits (Table 13). This implies that the cost-increasing effect is stronger than the sales-increasing effect of reputation capital. Even if the franchisor sets franchise fees and royalty levels that reflect the reputation capital accumulated in the brand, the sales of franchisees may not improve, as can be expected due to the fierce competition in the market. Notably, the fixed-rate royalty type had the smallest negative effect in terms of the extent of the decrease in the operating profit.
TABLE 13
ESTIMATION RESULTS OF FRANCHISEES’ OPERATING PROFIT
Note: Standard errors are in parentheses. *, **, and *** denote statistical significance at the 10%, 5%, and 1% level, respectively.
On the other hand, all types of business area protection tend to raise operating profit significantly. The business area guarantees exclusive commercial territories. Because it increases demand but does not increase costs, operating profit is likely to improve.
D. Effects of Contract Conditions on Franchisors’ Sales and Profits
The sales structure of franchisors is quite different from those of franchisees. The latter depends entirely on the purchases of end-consumers, but the former can be generated through various channels according to the formula below.
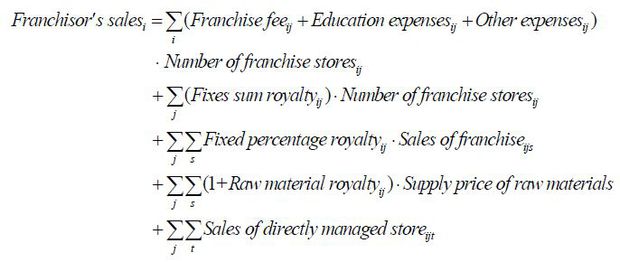
where i : Franchisor, j :Brand, s : Franchisee, t : Directly managed store.
According to model (1) in Table 14, a franchisor’s sales tend to rise as the ratio of directly managed stores and the period of the franchise business increase, similar to the trend found for franchisees. The reputation capital and business know-how accumulated in the brand act as positive factors not only for the sales of franchisees but also for the growth of the franchisors.
TABLE 14
ESTIMATION RESULTS OF FRANCHISOR’S SALES AND OPERATING PROFIT
Note: Standard errors are in parentheses. *, **, and *** denote statistical significance at the 10%, 5%, and 1% level, respectively.
The number of stores also has a positive effect, as opposed to a negative effect on franchisees. As the number of stores increases, franchisors come to have more channels for securing franchising fees, education fees, and royalties, meaning that their sales can increase. This confirms that franchisors have economic incentives to recruit more franchisees.
Interestingly but naturally, models (2) to (4) clearly show that franchise fees and all types of royalties are factors that increase the sales of franchisors. If the franchise fee increases by 1 million won, the franchise sales tend to increase by 440 million won, and when the fixed-sum, fixed-rate, and raw materials royalty levels increase by one unit, the franchise sales tend to increase by 4.35, 0.09, and 0.59 billion won, respectively. As shown in the formula above, these contract terms correspond to the franchisor's revenue source, making it likely that positive effects will result.
Models (5) to (7) estimate the effects of contract terms on the operating profit and reveal a distinct positive effect. This result is contrary to the situation of franchisees, where the operating profit decreases as the franchise fees and royalties increase. From this, we can guess the cause of the ongoing conflicts between the two parties over the distribution of value added.
The effects of business area protection also reveal contradictory results. While it helps franchisees have more sales and gain more operating profits, it diminishes those of franchisors by limiting the opening of additional stores. This is how the economic interests collide, from which we may forecast that disputes over infringements of business areas are likely to continue in the future.
VII. Policy Recommendations
Based on the empirical results, we can provide the following policy recommendations. First, the experience of running directly managed stores of franchisors should be clearly revealed in the Information Disclosure Documents. It is necessary to set items such as the 'start date of directly managed stores' and the 'period of the operation of directly managed stores before the franchise business' as mandatory provision items. Information on direct management experience can be used as an important criterion for franchisees to judge the degree of reputation capital of the brand and the appropriateness of franchise fees and royalties.
Next, it is necessary to pay more attention to the positive relationship between the business performance of franchisees and fixed-rate royalties, which are adopted by only a quarter of brands. Fixed-rate royalties significantly increase franchisee sales and have the smallest negative effect on operating profit compared to other types of royalties. This type also provides a strong incentive for franchisors to increase franchisees’ sales, which can enhance the win-win growth of the franchise market. In order to revitalize fixed-rate royalties, franchisors must be able to observe their franchisees’ sales transparently. As part of the small business supporting policy, the central government can consider supporting POS systems for franchisees of brands meeting certain criteria.
Also, it is necessary to strengthen the qualifications of franchising business so that the franchisor does not recruit franchisees with untested brands in the market. As in the overseas market, where the franchise industry has developed, the government needs to consider an institutional device that allows only franchisors with a certain degree of experience in operating a directly managed store to recruit franchisees.
Policy efforts are also needed to alleviate the reckless entry of franchisees into the market. In the domestic market, unprepared start-ups and overcrowding are aggravating factors, mainly in the food services and wholesale and retail businesses. This is highly likely to lower the profitability of individual franchisees by limiting the demand-increasing effect of reputation capital. Therefore, in some overcrowded industries, it is necessary to induce contemplated start-ups by restricting governmental or franchisee loans to a certain extent.
Notes
This paper is written based on Lee, 2018, Study on Franchise Contract and Franchise Market System, KDI Policy Study 2018-04 and: Lee, 2019, “Conflicts in the Franchise Industry: How to Forge a Win-Win Partnership,” KDI Focus No.96.
Disputes related to information asymmetry include cases in which Information Disclosure Documents were not submitted or those in which false (or exaggerated) information was provided. The imbalance of bargaining power can be related to issues such as unfair liability for damages, an unjustified termination of a contract, and territorial encroachment.
An Information Disclosure Document refers to a document that specifies general information such as the business status of the franchisor, the burden on the franchisees, and various contract conditions. In accordance with the “Act on the Fairness of Franchise Transactions,” all franchisors must file this document before recruiting franchisees.
An essential commodity refers to raw and subsidiary materials that franchisees must purchase from their headquarters or from a supplier designated by the headquarters for the purpose of standardizing products and services produced by franchisees.
In fact, in the wholesale and retail industry, convenience stores have the largest number of franchisees per brand. Looking at the status of the three major convenience stores, CU has 10,746, GS25 has 10,604, and 7-Eleven has 8,206 stores. This contrasts with the situation in the food service industry, such as Korean food (24), chicken (80), and coffee (50).
Despite concerns that this practice hinders market competition, it has been maintained as an obligatory clause for all franchisors according to the legislative purpose of the business stability of franchisees.
Usually, as the number of contract terminations and cancellations increases, the number of franchisees is expected to decrease. However, the number of franchisees showed high correlations with the number of contract terminations and cancellations, at 0.63 and 0.57, respectively. This can be understood considering that when the franchise market grows, the number of new openings increases to an extent that overwhelms the number of cancellations. In short, the number of franchisees reflects the effects of both new contracts and contract terminations.
The number of brands per total sales and the number of brands within a sector are measured at the middle class of the industry sector.
It is unclear as to whether a reputation for profitability affects the number of directly managed stores or brands, as in a situation where market risks exist, business expansion strategies through franchisees rather than directly managed stores can be considered first due to the nature of franchise businesses. In addition, there is a possibility that the strategic judgment and expectations of entrepreneurs play a greater role than the reputation in the expansion of directly managed stores.
The number of months of a franchise business cannot be completely free from the problem of endogeneity. This is true because if a product has high marketability and profitability, a positive reputation for the brand will be accumulated, which will increase the franchise fee and, at the same time, increase the survival rate of the business and increase the number of months of the franchise business. In order to remove the endogeneity caused by this simultaneity issue, it is necessary to control for the variables of product quality or marketability. Improvements in this area are left for future research.
An alternative method that can be considered is to estimate a fixed-effect model by constructing panel data for each franchisor (or brand). In future follow-up studies, it will be desirable to apply an effective methodology to eliminate the fixed effect based on franchise market data compiled over a longer term.
References
Fair Trade Commission Franchise. Fair Trade Commission Franchise, Franchise Disclosure Document, http://franchise.ftc.go.kr, last access: Nov. 11, 2018.