- P-ISSN 2586-2995
- E-ISSN 2586-4130

This paper aims to investigate whether there is empirical evidence supporting the learning-to-export hypothesis, which has received little attention in the literature. By taking full advantage of plant-product level data from Korea during 1990-1998, we find some evidence for the learning-to-export effect, especially for the innovated product varieties with delayed exporters: their productivity, together with research and development and investment activity, was superior to their matched sample. On the other hand, this learning-to-export effect was not significantly pronounced for industries protected by import tariffs. Thus, our empirical findings suggest that it would be desirable to implement certain policy tools to promote the learning-to-export effect, whereas tariff protection is not justifiable for that purpose.
Learning-to-export, Difference-in-differences, Matching
F13, F14
One of the most widely accepted stylized facts in the field of international trade is that exporters tend to outperform non-exporters in many respects. Since Bernard and Jensen (1995), substantial empirical literature has documented these findings for a large number of countries. In explaining this observed phenomenon, two alternative (but not mutually exclusive) hypotheses have been proposed in the literature.1 The first is what is known as the self-selection hypothesis, which states that exporting is a consequence of a firm’s productive capacity. Entry into the export market is profitable, but firms must incur irreversible entry costs in order to enter. Thus, only firms with sufficiently productive capacity self-select into the export market. Such interaction between the export market entry cost and firm productivity is an essential component of the heterogeneous firm theory developed by Melitz (2003) and others, such as Bernard et al. (2003) and Bernard, Jensen, and Schott (2006).
The second explanation is the learning-by-exporting hypothesis, which maintains that a firm’s productive capacity is a consequence of its entering the export market. Once a firm enters the export market, it undergoes faster growth as a result of fiercer yet more informative international competition and greater access to advanced technology. Under this hypothesis, firm productivity grows after entry into the export market.
As emphasized in Bernard and Jensen (1999), understanding how plants perform before and after exporting is of great importance in selecting appropriate policies. For example, if there are no post-entry rewards from exporting (i.e., no learning-by-exporting effect), then policies designed to increase the number of exporters may be wasting resources. On the other hand, if gains accrue to firms once they become exporters, then reducing the entry cost into foreign markets would be an appropriate policy stance. Many empirical studies have found that pre-entry differences present substantial evidence in favor of the self-selection hypothesis, but evidence regarding the learning-by-exporting hypothesis is mixed (Wagner, 2012).2
Yet another plausible argument can explain the pre-entry differences between exporters and non-exporters, although the literature has paid little attention to this facet. This argument is referred to as the learning-to-export or conscious self-selection hypothesis in López (2004); Alvarez and López (2005); Greenaway and Kneller (2007); and Eliasson, Hansson, and Lindvert (2012).
The main idea of this hypothesis is related to the timing of learning, arguing that learning takes place not when export sales begin but when the export decision is made. The export decision is usually made before export market entry. Once this decision is made, firms make conscious efforts to enhance their performance and improve the quality of their products to become exporters, thereby increasing their productivity endogenously.
If this effect is found to be empirically important, it can contribute to the existing literature from at least two standpoints. First, it may explain (at least some of the reasons) why firm productivity increases before export market entry. In contrast to previous heterogeneous firm theories where each firm’s productivity is assumed to be drawn from an exogenous distribution, productivity change can be understood as an endogenously determined process under the learning-to-export mechanism. Second, the effect can shed light on related policy issues as well. If firms enhance innovative and productive activities for the purpose of entering export markets, rewarding exporting ex post may then increase such activities at current non-exporters and successfully increase economic growth (Bernard and Jensen, 1999).
Thus, the main objective of this paper is to investigate whether empirical evidence supports the learning-to-export hypothesis by using manufacturing data from Korea during 1990-1998. However, identifying the learning-to-export effect is not an easy task owing to the unobservable nature of the time at which the decision to start to export is made, as mentioned in López (2004) and Greenaway and Kneller (2007). Recent empirical works investigating the learning-to-export effect, such as Eliasson, Hansson, and Lindvert (2012), rely on the assumption that the decision to start to export is made several years before engaging in actual exports.
As we will discuss in the next section, however, our rich plant-product matched dataset with yearly information on domestic and export market sales allows us to make another plausible assumption about the timing of the export decision. The main idea is that we focus our analyses on plants which innovate and introduce a new product variety only for the domestic market in the pertinent innovation year.3 In other words, when a new product variety is introduced for the domestic market, it will open a new opportunity for the plant to export this variety in the international market. Therefore, at the time of the introduction of the new product variety, plants can decide whether to export this product variety later by improving its productivity. If this is the case, we should observe plants’ conscious efforts to improve the quality of their product variety to become an exporter.
Another interesting issue that is worthwhile to analyze is the effectiveness of trade protection policies regarding the learning-to-export effect because, amongst the three different hypotheses between productivity and exports, learning to export is more closely related to the trade protection argument and can provide justification for such policies. For example, with the existence of the self-selection mechanism where intra-firm productivity is exogenously determined, trade protection cannot play any role with regard to changes in intra-firm productivity. At the same time, the learning-by-exporting effect implies that productivity increases only after international market participation and that trade protection therefore cannot be justified as well. As described in Slaughter (2004), dynamic arguments for infant industry protection tell us that trade protection can buy protected industries the time they require to learn before participating in the international market and to correct inefficiencies. Thus, for infant industry protection to be justified, we should observe the profound effect of learning-to-export in protected industries. Therefore, in our empirical analyses we will also investigate this possibility as much as our data allow us to do so.
The rest of this paper is organized as follows. In the next section, we explain our datasets and some definitions regarding product varieties. In section 3, we present our empirical methodologies and their main results to investigate the existence of the learning-to-export effect. In section 4, we investigate whether those learning-to-export effects arise disproportionately between protected and unprotected industries. Section 5 will provide some additional empirical results regarding the conscious efforts of firms to learn to export. The final section summarizes the results and concludes the paper.
This study utilizes three datasets. The first contains the unpublished plant-level data underlying the Mining and Manufacturing Census published by Statistics Korea for 1990-1998. It is an unbalanced panel dataset and covers all plants with five or more employees in the mining and manufacturing sector. The dataset has information on various plant characteristics, such as production, shipments, production and non-production workers, tangible fixed assets, and R&D expenditures.
The second dataset contains unpublished plant-product level data for the same period, which can be matched to the plant-level dataset through the plant identification number. A product is identified by an eight-digit product code which is constructed by combining the five-digit Korean Standard Industrial Classification (KSIC) code to which the product belongs and the three-digit code based on Statistics Korea’s internal product classification scheme. The product code is consistent over time during the period of analysis. For each plant-product observation, the values of total shipments (domestic plus export shipments) and export shipments are available. The plant-product dataset covers roughly 70%-80% of plants in the plant-level dataset.4 The coverage ratio is much higher for total and export shipments. Yearly total shipments and exports from the plant-product dataset account for more than 84.1% of shipments and virtually all (99.9%) of the exports in the plant-level dataset. Using the information on the plant-product level total and export shipments, we can identify which plant introduces a new product variety for the first time and amongst them which plant begins exporting the same product variety later, or not.5 This is crucial information in our analyses, as discussed below.
The last dataset we use in our analyses contains yearly import tariff data from the Korea Customs Service at the ten-digit level Harmonized System (HS) code for 1991-1998. This provides data on the value of the applied tariffs and imports for each HS category, and the import tariff rate can be directly calculated by dividing the value of the applied tariff by the value of the import. These tariff data with the HS code system have been converted into the four-digit International Standard Industrial Classification (ISIC) and in turn into KSIC codes. The trend of Korea’s import tariffs during 1991-1998 is reported in Table 1. As can be seen, the mean value of import tariffs across industries declined up to 1994 and stabilized after that year.
Before proceeding to explain our empirical strategies in more detail, first we explain briefly the structure of the plant-product level dataset and the definitions that we will use in our empirical part.
A product is defined at the eight-digit product code, which can be produced by multiple plants. We define product variety or variety as a product produced by a certain plant. Innovated product variety is defined from the viewpoint of plants for the period of 1992-1998. Specifically, an innovated product variety is a product variety which was not produced by a plant during 1990-1991 and which began to be produced by that plant for the first time during the period of 1992-1998. All other product varieties are existing or non-innovated product varieties. The product variety innovation year is the first year the innovated product variety was produced such that each innovated product variety has a unique product variety innovation year. We can define the new export (product) variety and new variety export year analogously. A new export product variety is a product variety which was not exported by a plant during 1990-1991 and which began to be exported by that plant for the first time during the period of 1992-1998. The new variety export year is the first year of exporting the new export variety.
Combining the definitions of innovated product variety and exported product variety (and product variety innovation year and new variety export year), we can categorize all of the product varieties into five different product types, as summarized in Table 2. First, the innovated product varieties can be categorized into the first three types: innovated product varieties with simultaneous export (IN_SE), that with delayed export (IN_DE), and that without export (IN_NE). Second, the non-innovated product variety can be categorized into the next two types: non-innovated product variety with export (NI_E) and that without export (NI_NE).
As shown in Table 3, the total number of product varieties is 402,312, amongst which the IN_NE type of product variety takes the highest share of 58.5%, followed by NI_NE 29.7%), IN_SE (8.8%), IN_DE (1.9%), and NI_E (1.1%).6 The basic statistics of the major variables for each product type are summarized in Table 4.7 For example, the initial value of total factor productivity (TFP) is highest for simultaneous exporters, while those of the other two innovated variety types are nearly the same. The initial TFP level is lowest for non-innovated product variety producers (NI_E and NI_NE).
Note: 1) Innovated varieties are categorized into IN_SE (simultaneous exporter), IN_DE (delayed exporter), and IN_NE (non-exporter), 2) Non-innovated varieties are categorized into NI_E (non-innovated exporter) and NI_NE (non-innovated non-exporter), 3) All basic statistics are calculated at the first year of each product variety, 4) TFP is measured using the method devised by Levinsohn and Petrin (2003), 4) Size is the natural logarithm of the number of employees, 5) Age is the log value of a plant’s age, 6) K/L is the ratio of capital to the number of workers in the log, 7) R&D is a dummy variable that takes a value of 1 if the value of research and development is positive and a value of 0 otherwise.
Source: Author’s calculations.
With regard to our empirical interest here, plants with the IN_DE type of product variety are most likely to demonstrate the learning-to-export effect. Because they introduce a newly innovated product variety first and then export it later with a delay, they are most likely to make conscious efforts to increase their productivity during these two time periods to become an exporter. Table 5 shows the number of years from innovation to export participation amongst the IN_DE type of product varieties. It takes only one year for the innovated variety to become an exported variety for around 53.1% of the IN_DE type of variety, two years for 23.7% of the IN_DE type of variety, and so on. Those years could be thought of as the periods during which the learning-to-export effect is most pronounced if it exists.
Source: Author’s calculations.
Regarding the other two types of innovated product varieties (IN_SE and IN_NE), the learning-to-export effect may not be profound compared to the results for the delayed exporters. For simultaneous exporters (IN_SE), the fact that they can innovate and export a specific product variety at the same time may imply that they are already capable of paying the fixed cost to participate in the export market and thus have little need to learn to export. In the case of innovators without exports (IN_NE), some of them may have the intention to become an exporter and make the necessary efforts to improve their productivity yet fail to export, while others may not even have such an intention.
As mentioned above, the most difficult part of our empirical investigation stems from the fact that the actual time of the decision to export is unobservable. Thus, we will take two different approaches in our empirical implementation, the choice of which depends on our assumptions of the timing of the decision to become an exporter.
The first approach assumes that the decision to become an exporter is directly related to the actual export participation time, which is the approach taken in most other papers on learning to export (e.g. López, 2004; Greenaway and Kneller, 2007; Eliasson, Hansson, and Lindvert, 2012). Put differently, given the observed export participation year, this approach assumes that the decision to become an exporter is made some years before the export participation year and investigates whether there is a learning-to-export effect between the decision year and the export year. To estimate the learning-to-export effect in the first approach, we compare the performance outcome (TFP) of plants with innovated product variety with delayed export (IN_DE) to that of plants with innovated product variety without export (IN_NE).8
The second approach assumes that the decision to become an exporter is directly related to the actual innovation time at which plants have a new opportunity to become an exporter. Because this approach requires not only export participation year data but also new innovation year data for each variety, we can take full advantage of our plant-product level data to investigate this issue. Under this approach, given the observed product variety innovation year, we assume that the decision to become an exporter is made at the product variety innovation year and investigate whether there are learning-to-export effects after this year. In this approach, we compare the performance outcome (TFP) of the innovated product variety to that of delayed export (IN_DE) with non-innovated product variety without export (NI_NE).
In either approach, the decision to become an exporter can be correlated with the data-generating process for the plant TFP. In this case, propensity score matching is a popular way to reduce the estimation bias associated with an endogenous participation decision. This can be done by comparing the outcome variable of the treated group (actual exporters amongst plants with innovated products) with that of the control group (non-exporters with innovated products or non-exporters without innovation), which are as similar to the treated group as possible. However, as explained by Heckman, Ichimura, and Todd (1997), when there is selectivity of the export decision based on unmeasured characteristics or if there are time-invariant level differences in outcome variables between treated and control groups, the difference-in-differences propensity score matching (DID PSM) estimator becomes a more appropriate econometric methodology. In this paper, we use a DID PSM estimator to estimate the effect of the export decision on TFP to measure the learning-to-export effect.
To apply the DID PSM method, we start by estimating the following probit model:
where P(X i) is the probability of becoming an exporter for plant i conditional on the vector of pre-exporting characteristics X i and d i is a dummy indicating export market participation. As pre-exporting characteristics, we include the variables considered to be important in other studies, for example the log of the plant TFP, the log of the number of employees as a proxy for the plant size, the log of the plant age, the log of the plant’s capital-labor ratio and a dummy variable indicating whether the plant is engaged in R&D.
All of these explanatory variables are lagged by three years; accordingly, the plant characteristics in the probit model are the values three years before the plant begins to export. This approach allows us to examine whether there is a learning-to-export effect in the outcome variables up to two years before actual exporting started.9 The results of these probit estimations are reported in Table 6, which shows that more productive, larger, younger, more capital-intensive, and more R&D-engaged plants are more likely to become exporters.10
Note: 1) TFP is measured with the method of Levinsohn and Petrin (2003), 2) Size is the natural logarithm of the number of employees, 3) Age is the log value of the plant’s age, 4) K/L is the ratio of capital to the number of workers in the log, 5) R&D is a dummy variable that takes a value of 1 if the value of research and development is positive and a value of 0 otherwise, 6) Robust standard errors are in parentheses, 7) *, **, and *** indicate that the estimated coefficients are significant at the 10%, 5%, and 1% levels, respectively.
Next, based on the estimated propensity score, a set of plants categorized as ‘innovated product variety without export’ is matched with ‘innovated product variety with delayed export’. Here, let T and C denote the set of treated (IN_DE) and control (IN_NE) units and yT and yC be the observed outcomes of the treated and control units, respectively, while i and j are correspondingly the indexes for the treated and control units. The subscript t0 is some time before exporting, which is set to three years before exporting in this case. The subscript s represents the number of years after exporting starts. We denote the set of control units matched to treated unit i by C(i) , the number of control units matched with i∈T by NC and the number of plants in the treated units by NT . Then, the propensity score DID estimator at s -years after export market entry is given by
where 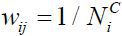 if j∈C(i) and wij = 0 otherwise.
The results of the DID PSM estimates are reported in Tables 7 and 8.11 Table 7 shows the results when plants of the IN_DE type (plants with innovated product variety with delayed export) are included as treated units and plants of the IN_NE type (plants with innovated product variety without export) serve as control units. As shown in Table 7, we find strong evidence to support self-selection: the cross-section PSM and DID PSM estimates tells us that the TFP of IN_DE type outperforms the IN_NE type by 11.4% and 7.5% respectively. Regarding the learning-to-export effect, the evidence is somewhat mixed. While the PSM estimates at s = −2 are statistically insignificant, those at s = −1 are statistically significant; the differences are 3.5% and 2.9% depending on the PSM methodology.
Note: 1) Robust standard errors are in parentheses, 2) *, **, and *** indicate that the estimated coefficients are significant at the 10%, 5%, and 1% levels, respectively.
For comparison, we repeat the same procedure when plants of the IN_SE type (plants with innovated product variety with simultaneous export) are included as treated units (Table 8). In this case, we find better performance of the IN_SE type plants over their matched IN_NE type plants at s = −1 and s = −2 . For example, if we look at the estimated results of DID PSM in Table 8, the IN_SE type plants’ TFP outcome is higher than that of the IN_NE type plants by 3.3% at s = −2 and 2.9% at s = −1 . However, because IN_SE plants simultaneously innovate and export at s = 0 , the superior performances of s = −1 and s = −2 may reflect both the learning-to-export and learning-to-innovate effects.
Note: 1) Robust standard errors are in parentheses, 2) *, **, and *** indicate that the estimated coefficients are significant at the 10%, 5%, and 1% levels, respectively.
At this point, we turn to the empirical results under our next (and preferable) approach, where we assume that the export decision is more directly related to the timing of new product variety innovation.
Our second approach assumes that the decision to become an exporter is more directly related to the actual innovation time at which plants have a new opportunity to become an exporter. In this case, although the estimation procedures are nearly identical, there are several differences from the first approach. First, when estimating equation (1) to obtain the propensity score, di is a dummy variable indicating product variety innovation (instead of export market participation). In addition, there is no lag structure in the explanatory variables when estimating equation (1), although we include the set of explanatory variables used before. Second, when we estimate the DID PSM in equation (2), t0 is the year in which the actual product variety innovation is introduced. Thus, by estimating the DID PSM at s = +1, + 2, and + 3, we can estimate the learning-to-export effect after product variety innovation for IN_DE type plants compared to that of NI_NE (non-innovated and non-exported) plants.
The result of the probit estimation to obtain a sample in NI_NE matched to the IN_DE sample is reported in Table 9. As in Table 6, more productive, larger, younger, more capital-intensive, and more R&D-engaged plants are more likely to become innovators.
Note: 1) TFP is measured by the method of Levinsohn and Petrin (2003), 2) Size is the natural logarithm of the number of employees, 3) Age is the log value of the plant’s age, 4) K/L is the ratio of capital to the number of workers in the log, 5) R&D is a dummy variable that takes a value of 1 if the value of R&D is positive and a value of 0 otherwise, 6) Robust standard errors are in parentheses, 7) *, **, and *** indicate that the estimated coefficients are significant at the 10%, 5%, and 1% levels, respectively.
With a matched sample, we estimated the DID PSM as before where the treatment unit is IN_DE type varieties and the control unit is NI_NE type varieties. As shown in Table 10, the DID PSM results show a statistically significant learning-to-export effect this time. After the first, second, and third year of product variety innovation, the TFP differences between IN_DE and NI_NE are 4.1%, 4.0%, and 3.9%, respectively.12
Note: 1) Robust standard errors are in parentheses, 2) *, **, and *** indicate that the estimated coefficients are significant at the 10%, 5%, and 1% levels, respectively.
Note that when the learning-to-export effect is estimated at s = +1 (i.e., just after the innovation year), all IN_DE samples are used in the entire procedure. However, when we estimate this effect at s = +2 , we exclude the product varieties with one year of the innovation-export lapse (the samples in the first line in Table 5). This is done because these product varieties are already exported at s = +1. By the same reasoning, when we estimate the learning-to-export effect at s = +3 , the product varieties with one and two years of an innovation-export lapse (the samples in the first and second lines in Table 5) are excluded as well.
The next question we would like to ask is whether these types of learning-to-export effects, if any, are dependent on the degree of import protection as set by tariff policies. As mentioned in section 1, amongst the three different hypotheses pertaining to the link between productivity and exports, learning to export is more closely related to the trade protection argument and can provide justification for such policies. For example, with the existence of a self-selection mechanism where intra-firm productivity is exogenously determined, trade protection cannot play any role in changing intra-firm productivity. At the same time, the learning-by-exporting effect implies that productivity increases only after international market participation, meaning that trade protection cannot be justified as well. As described in Slaughter (2004), dynamic arguments for infant industry protection tell us that trade protection can buy protected industries the time they require to learn before participating in the international market and to correct inefficiencies. In this section, we investigate this possibility.
However, because our DID PSM estimate in the previous section relies on a non-parametric methodology that gives a single estimated value, it would not be appropriate to use it to tackle this issue. To mitigate this issue, we return to the usual parametric DID estimation procedure combined with a matching technique. Having estimated the probit model in equation (1) and matched the sample between the treated (IN_DE type) and control units (NI_NE type), we run the following parametric DID model:
Here, yi is the outcome variable (in our case TFP), IN_DEi he treatment dummy variable (1 if innovated product variety with delayed export and 0 if non-innovated variety without export), and ti the time dummy (0 at the time when the innovation occurs and 1 after the innovation occurs). In this specification, the estimated γ represents the DID treatment effect.
The estimated results of equation (3) are shown in Table 11. The DID treatment effect is 5.2% of the TFP difference at s = +1, 4.6% at s = +2 , and 5.1% at s = +3 . These results are broadly consistent with the DID PSM result in Table 10.
Note: 1) The dependent variable is the natural logarithm of TFP measured using the method devised by Levinsohn and Petrin (2003), 2) IN_DE is a dummy variable that takes a value of 1 if the product variety belongs to IN_DE and a value of 0 to the matched sample in NI_NE, 3) Time is a dummy variable that takes a value of 0 when innovation takes place and a value of 1 after s-year, where s = 1, 2, or 3, 4) Industry dummies are constructed on the 3-digit Korean Standard Industrial Classification level, 5) Robust standard errors are in parentheses, 6) *, **, and *** indicate that the estimated coefficients are significant at the 10%, 5%, and 1% levels, respectively.
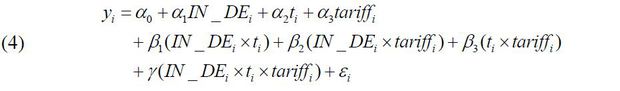
To determine whether there are any disproportionate learning-to-export effects according to protection policies, we extend equation (3) to the following triple DID estimation equation.
In this specification, we focus on the triple interaction term γ , because it represents whether the DID estimate depends on the tariff rate. This can be easily found by taking the partial derivative of equation (4) with respect to tariffs:
The right-hand side of equation (5) is identical to equation (3), meaning that γ captures the extent to which and the direction by which the effect of tariffs on the outcome depends on the DID term ( IN _ DEi × ti ).
Table 12 shows the triple-differences estimation results of equation (4) above. The triple-differences terms in Table 12 are all estimated to be negative and statistically significant only at s = +1 . The negative sign implies that the learning-to-export effect is lower when the tariff rate is high, and this is particularly significant one year after the innovation year. This empirical result appears to argue against the infant industry argument: protection by the tariff rate may not justifiable to enhance the learning-to-export effect according to our data.
Note: 1) IN_DE is a dummy variable that takes a value of 1 if the product variety belongs to IN_DE and a value of 0 to the matched sample in NI_NE, 2) Time is a dummy variable that takes a value of 0 when innovation takes place and a value of 1 after s-year where s = 1, 2, or 3, 3) Industry dummies are constructed based on the three-digit Korean Standard Industrial Classification level, 4) Robust standard errors are in parentheses, 5) *, **, and *** indicate that the estimated coefficients are significant at the 10%, 5%, and 1% levels, respectively.
The analyses in sections 3 and 4 imply that some evidence of the learning-to-export effect for the IN_DE type of product varieties exists in the sense that their productivity outcome is superior to the corresponding control group after the innovation and that tariff protection does not help to promote such a learning-to-export effect. This leads to the question of the origin of this superior productivity outcome. López (2004) emphasized that such a learning-to-export effect can be accomplished by firms that consciously invest more in physical or knowledge capital. Thus, we investigate this possibility in this section with our dataset.
Table 13 shows how three different outcome variables (the capital-labor ratio, R&D dummy, and investment dummy variable) behave under the DID specifications in equation (3). All procedures are identical to those used before, but the dependent variables are replaced with other outcome variables. The DID terms (IN_DE * time) in Table 13 are estimated to be positive, and most of them are statistically significant with two exceptions (the K/L ratio and investment dummy at s = +3 ). This means that physical capital and R&D activities are higher for IN_DE group varieties after innovation and before export participation compared to the corresponding control group. This in turn implies that the higher productivity performance of IN_DE varieties is closely related to their investment in physical capital and R&D activities.
Note: 1) IN_DE is a dummy variable that takes a value of 1 if the product variety belongs to IN_DE and a value of 0 to the matched sample in NI_NE, 2) Time is a dummy variable that takes a value of 0 when innovation takes place and a value of 1 after s-year where s = 1, 2, or 3, 3) Industry dummies are constructed based on the three-digit Korean Standard Industrial Classification level, 4) Regressions of the R&D dummy and investment dummy are run by probit specification, 5) Robust standard errors are in parentheses, 6) *, **, and *** indicate that the estimated coefficients are significant at the 10%, 5%, and 1% levels, respectively.
The next natural question is therefore whether these conscious efforts of firms are related to the tariff protection. In Table 14, we run triple differences (equation (4)) for the three different outcome variables once again. As shown in the table, the estimated coefficients of the triple-difference term (IN_DE * time * tariff) are all insignificant, except for the K/L ratio at s = +1. As in the productivity outcome case, protection by import tariff cannot be justified to induce firms to invest more in physical capital and R&D activities.
Note: 1) IN_DE is a dummy variable that takes a value of 1 if the product variety belongs to IN_DE and a value of 0 to the matched sample in NI_NE, 2) Time is a dummy variable that takes a value of 0 when innovation takes place and a value of 1 after s-year where s = 1, 2, and 3, 3) Industry dummies are constructed based on the three-digit Korean Standard Industrial Classification level, 4) Robust standard errors are in parentheses, 5) *, **, and *** indicate that the estimated coefficients are significant at the 10%, 5%, and 1% levels, respectively.
Using Korean manufacturing data for 1990-1998, this paper aimed to investigate whether empirical evidence supports the learning-to-export hypothesis, which has received little attention in the literature thus far. By taking full advantage of our plant-product level data, we find some evidence of the learning-to-export effect, especially for innovated product varieties with delayed exports. Our DID estimation results combined with propensity score matching imply that between the time of innovation and export participation, innovating firms show superior productivity performance compared to matched control groups. Moreover, other performance outcome variables tested here, i.e., the K/L ratio, R&D dummy, and an investment dummy variable, also behave similarly. Thus, during the time lapse between innovation and export, productivity, K/L ratio, R&D, and investment move in the same direction; this is an indication of the learning-to-export effect. However, our triple-differences estimation results show that protecting industries by means of higher import tariffs is not justifiable to enhance learning-to-export effects in all specifications with different outcome variables.
In this appendix, we re-estimated our TFP outcomes following Ahn and Choi (2020) and then re-did the same exercise described in Tables 9 and 10. With a conventional method of estimating TFP following Levinsohn and Petrin (2003), we added the industry-level share of imported inputs. First, we used the input-output table for 1990-1995-2000 and calculated the imported input share by industry at the KSIC two-digit level. Given that the input-output table has information only for the three years above (1990, 1995, and 2000), we interpolate the imported input shares in other years. Subsequently, we used this imported input share to estimate the TFP, as in Ahn and Choi (2020). The following two tables correspond to Tables 9 and 10 in the main text. As indicated, there are no qualitative changes when conducting the same analyses with this new TFP measure.
Note: 1) TFP is measured using the method devised by Levinsohn and Petrin (2003), 2) Size is the natural logarithm of the number of employees, 3) Age is the log value of the plant’s age, 4) K/L is the ratio of capital to the number of workers in the log, 5) R&D is a dummy variable that takes a value of 1 if the value of R&D is positive and a value of 0 otherwise, 6) Robust standard errors are in parentheses, 7) *, **, and *** indicate that the estimated coefficients are significant at the 10%, 5%, and 1% levels, respectively.
Note: 1) Robust standard errors are in parentheses, 2) *, **, and *** indicate that the estimated coefficients are significant at the 10%, 5%, and 1% levels, respectively.
This work was supported by the Ministry of Education of the Republic of Korea and the National Research Foundation of Korea (NRF-2018S1A5A2A03037147). It was initiated as part of the research project of ‘Micro-dynamics of Industrial Development and Trade and Industrial Policy’ by Economic Research Institute for ASEAN and East Asia (ERIA). The authors are deeply indebted to the members of this project for their invaluable suggestions.
See Greenaway and Kneller (2007) and Wagner (2012) for an extensive literature review on this issue.
A growing body of studies has found some evidence for the learning-by-exporting hypothesis in developing countries, particularly Girma, Greenaway, and Kneller (2002) for the United Kingdom; Van Biesebroeck (2005) for sub-Saharan African countries; De Loecker (2007) for Slovenia; Albornoz and Ercolani (2007) for Argentina; Aw, Roberts, and Xu (2011) for Taiwan; Ma, Tang and Zhang (2014) for China; and Hahn (2005; 2012) for Korea.
Thus, we exclude plants which introduce a new product variety into the domestic and export market simultaneously in our main empirical analyses. These plants may already have productivity high enough to pay the entry cost and therefore have little incentive for learning to export.
It may be more desirable to conduct firm-level analyses rather than plant-level analyses because the export decision itself can be made at the firm level. A recent paper by Chun, Hur, Son, and Yoon (2019) for the period of 2007-2013 found some indirect spillover effects at the plant level within firms in terms of export decisions. However, the current data we have do not contain firm-IDs, making it impossible to conduct a firm-level analysis in our empirical part.
The share of exported varieties (i.e., IN_SE, IN_DE and NI_E) appears to be low (11.8% in total in Table 3) because in this table we counted the numbers of product varieties of each type, while the quantities of production and export were not taken into account. If we calculate the share of export value out of total shipments using the same dataset for 1990~1998, it ranges from 23.4 to 36.4% (not reported here but available upon request). This means that exported products are concentrated within a small set of product varieties. We would like to thank an anonymous referee for clarifying this point.
The figures in Table 3 and 4 are reported from the viewpoint of “product varieties,” not “plants.” In other words, a multi-product plant that produces both IN_SE and NI_E, for example, is included in both product type categories. In our main empirical analyses below in section 3, we excluded these multi-product plants that belong to both a treatment group and a control group for product type. Because the share of these multi-product plants is relatively small, whether or not they are included in the sample does not change our main empirical results substantially. Section 3 contains more details on this issue. We would like to thank an anonymous referee for pointing this out.
We can also compare other pairs of product variety types, e.g. IN_SE and IN_NE. Although this is not our major interest, it is reported in our empirical results for comparison.
This empirical setup using explanatory variables with three-year lags implies that the decision to export is assumed to have been made three years before actual export participation. This assumption may seem to be ad hoc, but this has precedent, such as in Eliasson, Hansson and Lindvert (2012).
This is the first procedure to apply the matching technique below. By running this probit regression, we find plants for the treated group and control group that are as similar as possible at the time of exp ort decision (three years before the actual export participation). We then assume that learning-to-export takes p lace between the time of the export decision and actual export participation because at the time of export decision p lants start endogenously to choose to learn to export. Self-selection is assumed to occur at the time of ac tual export participation. We would like to thank an anonymous referee for clarifying this point.
As mentioned in the footnote 6, our results in section 3.2 exclude the plants that belong to both the treated group and the control group. In the first column in both Table 6 and Table 7, where we analyze the performance outcomes of IN_DE and IN_NE, 3,585 (2.8%) out of 128,982 plants belong to both groups; the rest of them produce only one product variety. Similarly in the second column of Table 6 and Table 8, where we analyze the performance outcomes of IN_SE and IN_NE, 6,627 (5.0%) out of 131,986 plants belong to both groups; the rest of them produce only one product variety. Dropping these double-counted plants does not change our empirical results that much.
As a robustness check, we conduct the same exercise as in Tables 9 and 10 with a new measure of TFP. Kasahara and Rodrigue (2008) and Ahn and Choi (2020) identified a significant economic role of foreign imported input as a necessary factor in measurement of total factor productivity. Thus, following Ahn and Choi (2020), we re-estimated TFP by taking into account the import share of input. These results are reported in Tables A1 and A2 in the appendix, which correspond to the results in Tables 9 and 10, respectively. Comparing Tables 9 and A1 and Tables 10 and A2, we do not find any qualitative changes, confirming the robustness of our results. Other results are also determined with new measure of TFP; while not reported here, they are available upon request. We would like to thank an anonymous referee for suggesting this robustness check.
, & (2005). Exporting and Performance: Evidence from Chilean Plants. Canadian Journal of Economics, 38(4), 1384-1400, https://doi.org/10.1111/j.0008-4085.2005.00329.x.
, , & (2011). R&D Investment, Exporting and Productivity Dynamics. American Economic Review, 101(4), 1312-1344, https://doi.org/10.1257/aer.101.4.1312.
, & (1999). Exceptional Exporter Performance: Cause, Effect, or Both? Journal of International Economics, 47(1), 1-25, https://doi.org/10.1016/S0022-1996(98)00027-0.
, , , & (2003). Plants and Productivity in International Trade. American Economic Review, 93(4), 1268-1290, https://doi.org/10.1257/000282803769206296.
, , & (2006). Trade Costs, Firms and Productivity. Journal of Monetary Economics, 53(5), 917-937, https://doi.org/10.1016/j.jmoneco.2006.05.001.
, , , & . (2019). Do non-exporting plants benefit from exporting peer plants? Asian Economic Journal, 33(3), 221-234, https://doi.org/10.1111/asej.12184.
(2007). Do Exports Generate Higher Productivity? Evidence from Slovenia. Journal of International Economics, 73(1), 69-98, https://doi.org/10.1016/j.jinteco.2007.03.003.
, , & (2012). Do Firms Learn by Exporting or Learn to Export? Evidence from Small and Medium-Sized Enterprises. Small Business Economics, 39(2), 453-472, https://doi.org/10.1007/s11187-010-9314-3.
, & (2007). Firm Heterogeneity, Exporting and Foreign Direct Investment. The Economic Journal, 117(517), F134-F161, https://doi.org/10.1111/j.1468-0297.2007.02018.x.
, , & (1997). Matching as an Econometric Evaluation Estimator: Evidence from Evaluating a Job Training Programme. Review of Economic Studies, 64(4), 605-654, https://doi.org/10.2307/2971733.
, & . (2008). Does the use of imported intermediates increase productivity? Plant-level evidence. Journal of Development Economics, 87, 106-118, https://doi.org/10.1016/j.jdeveco.2007.12.008.
, & (2003). Estimating Production Functions Using Inputs to Control for Unobservables. Review of Economic Studies, 70(2), 317-341, https://doi.org/10.1111/1467-937X.00246.
, , & (2014). Factor Intensity, Product Switching, and Productivity: Evidence from Chinese Exporters. Journal of International Economics, 92, 349-362, https://doi.org/10.1016/j.jinteco.2013.11.003.
(2003). The Impact of Trade on Intra-Industry Reallocations and Aggregate Industry Productivity. Econometrica, 71(6), 1695-1725, https://doi.org/10.1111/1468-0262.00467.
(2005). Exporting Raises Productivity in Sub-Saharan African Manufacturing Firms. Journal of International Economics, 67(2), 373-391, https://doi.org/10.1016/j.jinteco.2004.12.002.
(2012). International Trade and Firm Performance: a Survey of Empirical Studies since 2006. Review of World Economy, 148, 235-267, https://doi.org/10.1007/s10290-011-0116-8.