
Why Are Peak Loads Observed during Winter Months in Korea?
Abstract
Since 2009, electricity consumption has developed a unique seasonal pattern in South Korea. Winter loads have sharply increased, and they eventually exceeded summer peaks. This trend reversal distinguishes these load patterns from those in the USA and the EU, where annual peaks are observed during the summer months. Using Levene’s test, we show statistical evidence of a rise in temperature but a decrease in variance over time regardless of the season. Despite the overall increase in the temperature, regardless of the season there should be another cause of the increased demand for electricity in winter. With the present study using data from 1991 to 2012, we provide empirical evidence that relatively low electricity prices regulated by the government have contributed significantly to the rapid upward change in electricity consumption, specifically during the winter months in the commercial sector in Korea.
Keywords
Electricity Demand, Energy Demand, Commercial Sector, Price Elasticity
JEL Code
L94, Q41, Q48, Q51, Q54
I. Introduction
Climate change affects societies and natural ecosystems in different ways, and these effects influence human behavior and economic performance as people adapt to climate change (De Cian et al., 2013). Electricity generation is also significantly influenced by climate change, as cooling and heating are significant quantities of electricity loads in most advanced economies. A statistical link between temperature changes and electricity consumption has been tested for the UK (Henley and Peirson, 1998), Norway (Vaage, 2000), China (Asadoorian et al., 2006), the USA (Mansur et al., 2008; Zarnikau, 2003), and South Korea (Kim et al., 2016). Initially, we aimed to evaluate the impact of weather variations on electricity consumption in South Korea (henceforth Korea). In summarizing the data, we find that winter loads increased by 7.83 percent annually during 1991-2012, greater than the annual growth rate of summer loads (7.17 percent). This implies that the rapid increase in electricity consumption is not solely attributed to weather changes, as the rise in the temperature is observed not only in the summer months but also during the winter months. Thus, we conducted a closer investigation to find other driving forces that could cause a sharp rise in winter loads. From our empirical analysis, we find that the main drivers accelerating electricity demand are changes in the temperature and the relatively low electricity prices compared to substitute fuel prices in Korea. This influences winter loads more than summer loads considering that there are no substitute fuels for cooling whereas some substitute fuels do exist with regard to heating in winter. As electricity becomes less expensive, people heat their homes and workplaces using electricity. Consequently, due to the low opportunity cost of electricity, winter loads increased more than summer loads during the sample period, although winters are getting warmer in Korea. Of course, summer loads are also increasing due to temperature changes associated with global warming.
The increase in the demand for electricity caused by the relative price disparity can be an environmental problem because Korea’s electricity production relies on thermal power generation, which represents 66.7 percent of all electricity generated as of 2014. The generation structure causes harmful gas emissions, including carbon dioxide (CO2) and PM10 microparticles due to the burning of fossil fuels to generate electricity.
Data from various sources are employed in this study, including monthly temperature data during the period of 1991-2012 from the Korea Meteorological Administration, electricity consumption by sector from the Korea Energy Economics Institute (Korea Energy Statistics Information System), sector-specific electricity and gas prices (henceforth, natural gas prices) from the Korea Power Exchange (Electric Power Statistics Information System), and social and economic data from Statistics Korea (Korea Statistics Information Service).
The remainder of the paper is organized as follows. Section 2 illustrates the characteristics of electricity loads and prices in Korea and tests whether or not a significant weather change which increased the winter load occurred. Section 3 explains the assessment model, and the estimation results are presented in Section 4. Finally, Section 5 concludes this study and presents policy implications.
II. Weather Change and Electricity Demand in Korea
A. Unique Seasonal Pattern of Electricity Loads in Korea
In line with the steady economic growth of the country over the past few decades, electricity consumption in Korea has also increased (see Figure 1). From 1991 to 2012, total electricity consumption grew at an annual growth rate of 7.39%. It is important to note that all of the growth rates exceeded the GDP rate (4.37%).
FIGURE 1.
TREND OF KOREA’S ELECTRICITY CONSUMPTION (1991-2012)
Source: Korea Electric Power Corporation.
On the other hand, it is of interest to observe that annual peaks in the total demand were observed in summer months in the past but more recently have occurred during the winter months.1 Figures 2 and 3 show that a trend reversal in the peak load has occurred since 2009 and that monthly electricity demand had the highest electricity loads during the winters of the years 2011 and 2012 compared to previous years (1991 and 1992). This seasonal pattern is unique because peak loads are usually observed in summer months in most advanced economies with climatic and economic conditions similar to those of Korea.
FIGURE 2.
SEASONAL TREND REVERSAL OF PEAK LOADS (2001-2014)
Source: Electric Power Statistics Information System.
FIGURE 3.
MONTHLY ELECTRICITY DEMAND (1991-1992 VS. 2011-2012)
Source: Korea Electric Power Corporation.
The economic literature provides possible drivers of electricity consumption. These can include weather changes (Pardo et al., 2002; Madlener and Alt, 1996; Parti and Parti, 1980; De Cian et al., 2013), changes in the relative prices between electricity and its substitutes (Silk and Joutz, 1997; Crowley and Joutz, 2005), increases in populations and/or numbers of households (Holtedahl and Joutz, 2004), and structural transformations from primary industries to manufacturing sectors and/or from less energy-intensive sectors to energy-intensive sectors (Lin et al. 2014); increases in income and demand for electronic instruments (Bose and Shukla, 1999; Medlock and Soligo, 2001; Filippini and Pachauri, 2004). In the case of Korea, existing studies of the factors pertaining to electricity demand mainly deal with demand forecasting according to the climate and temperature and the price effects on aggregate demand (Kim et al., 2011; Kim et al., 2015). There are few studies that attempt to quantify the effects of electricity prices and relative prices on demand in the commercial sector.
B. Features of Electricity Load in the Commercial Sector
Although the overall peak demand during recent years has undergone a trend reversal, as described in Section 2.A., the rate of consumption growth varies across sectors. Electricity demand in the commercial sector has attracted our attention owing to the rapid growth rates as well as the clear seasonal patterns that developed in the early 2000s.
With regard to the annual growth rates of electricity loads in different sectors, the highest is observed in the commercial sector (10.48%), while the rate for the industrial sector stands at 6.59%. The residential sector records the lowest growth rate of 5.79%. The commercial sector records the highest growth rates when the rates are divided into summer months and winter months (11.57% for winter loads and 9.80% for summer loads; see Table 1).
TABLE 1
SUMMARY OF ELECTRICITY CONSUMPTION AND ANNUAL GROWTH RATES BY SECTOR
Source: Author's own calculations; Korea Electric Power Corporation.
Consequently, the electricity consumption shares for the commercial sector increased from 15.6% in 1991 to 28.3% in 2012 (see Figure 4). The industrial sector’s proportion with reference to total electricity consumption was still highest in 2012 (53.5%) but was lower than the 1991 level (62.5%). The residential sector also shows a decrease in the consumption share, which stood at 13.6% compared to the 1991 level (18.7%).
Figure 5 shows a clear seasonal pattern in the electricity demand in the commercial sector. The electricity load in the commercial sector had the highest peak in summer in the earlier years of our sample period (1991 and 1992), but the peak occurred in winter in more recent years (2011 and 2012). Meanwhile, electricity consumption in the industrial sector does not show any seasonal patterns. This figure implies that the trend reversal in the total demand is associated with an apparent change in the trend of the commercial sector.
C. Testing Changes in Temperature with Daily Data from 1973 to 2012
Temperature changes may explain the recent peak loads during the winter months. If winters have been getting colder over recent years compared the past, the more recent lower temperatures may have increased the demand for power during the winter months. A comparison between present and past temperatures is conducted in this section.
The weather data employed in this paper are derived from a database maintained by the Korea Meteorological Administration (KMA). Daily weather data is available for an extended period, from 1972 to 2012, longer than the period for electricity data (1991- 2012). Daily temperature records are compared over the summertime (wintertime) between the most recent data years, 2003-2012, and the earliest, 1973-1982.2
Table 2 presents a summary of the daily mean weather variations over the summertime, i.e., from June to August, and the wintertime, from December of one year through February of the next throughout the study period of interest. As shown in the table, the daily mean temperatures appear to have increased by 0.67°C and 0.57°C on average in wintertime and summertime, respectively, which may reflect global warming.
The means and variances for the summer daily maximum temperature during the two periods, denoted by Highest in Table 2, describe summer temperatures as higher and the heat as more persistent for the recent period as compared to the past because the recent summer mean is higher than that of the past. However, the order is opposite for the variance. At the same time, the mean of the winter daily lowest temperature, denoted by Lowest, is higher and the variance is smaller for recent years than for the past. This means that the recent winter cold is less severe and that there have been fewer extremely cold days in recent years compared to the past. Winters have been less cold for consumers, and they have experienced warmer temperatures in summer as well.
TABLE 2
WEATHER SUMMARY FOR THE PAST AND RECENT PERIODS (1973-1982 AND 2003-2012)
Note: The number for Lowest is smaller than the number for Highest because there are fewer days in February, belonging to the Lowest category, compared to the other months.
Source: Korea Meteorological Administration (KMA).
Using Levene’s test, we evaluate whether these differences are statistically significant. The test results are summarized in Table 3. At the 5% significance level, extreme weather events have significantly unequal variances over the two decades of wintertime. This can be evidence explaining that the recent surge in the demand for electricity in winter cannot be explained by temperature changes. Hence, there should be other factors. Given the fact that consumers have experienced winters which have been less cold, there should have been compelling reasons for the change in behavior. We assume that there should be a change in the choice of heating fuel by which to create electricity from other fuels.
D. Testing Monthly Temperature Data for our Sample Period (1991-2012)
Temperature is one of the important drivers of electricity consumption because heating and cooling purposes account for a large share of end-use energy consumption. Heating demand in winter accounts for 24% of the total demand, and 80% of the heating demand came from the commercial sector in 2011.3 Temperature effects are asymmetric because higher temperatures decrease the demand for heating and increase the demand for cooling at the same time. In order to adjust for this asymmetry problem, heating degree days (HDD) and cooling degree days (CDD) are widely used variables for testing climate change-driven effects in the electricity demand model. The more extreme the temperature is, the higher the HDD or CDD number becomes. A high HDD or CDD number represents higher corresponding levels of heating and cooling demand associated with extreme temperatures.
In our electricity demand model proposed in Section 3, we trace the HDD and CDD metrics for weather variables and include monthly summations of HDD and CDD along with other monthly variables. These are defined below.

Here, hi = (T0 – Ti , 0), ci = max(Ti – T0 , 0), Ti is the daily mean temperature of day i , T0 = 18°C, and N is the number of days in a month.
Summary statistics for these two variables for 22 years from 1991 to 2012 are shown in Table 4. During the sample period, the aggregate values of CDD increased by 0.739 percent annually (from 577.41 in 1991 to 673.9 in 2012). However, there was little change (0.209%) in HDD (yearly aggregates are 2,664.24 and 2,784.02 in 1991 and 2012, respectively).
While HDD remained relatively stable over the period, the increase in CDD implies that electricity consumption is expected to increase more for cooling than for heating during the same period. However, the annual growth rate for the average winter loads during 1991- 2012 (7.83 percent) shows the opposite and exceeds the growth rate of the average summer load by more than 0.6% (see Table 1).
E. Electricity Prices and Relative Prices to Competing Fuels
A loose relationship between electricity loads and weather variables (CDD and HDD) indicates that there exist non-weather factors that drive the increase in electricity consumption. In this paper, special attention has been paid to the effects of electricity prices and the corresponding relative prices on electricity demand. Retail electricity rates in Korea are supposed to reflect the various costs of serving customers over a year or season (Braithwait et al., 2007). However, the actual pricing practice in Korea is different. Due to the Price Stabilization Act in Korea, which sought to stabilize consumer price levels and support price competitiveness in the international market, retail electricity prices are regulated, and its cost recovery rate has been lower than 1, as shown in Figure 6.
As addressed in Section 2.B., the surge in winter electricity demand was observed in the commercial sector. When electricity prices are compared by sector, the commercial sector price (in real terms) has considerably declined since 2000, and the largest price gap between the residential and commercial sectors was recorded from 2000 to 2010 (see Figure 7). This trend stands in contrast to that of the energy consumption share by sector. The difference in the energy consumption share by sector was smallest over the same period (see Figure 4).
FIGURE 7.
ELECTRICITY PRICE BY SECTOR IN KOREA (1991-2012)
Source: Electric Power Statistics Information System.
A comparison of the electricity price versus the price of alternative fuels in the commercial sector suggests a link between the relatively low costs of electricity and the level of demand. Figure 8 presents the prices of electricity and natural gas in the commercial sector from 1991 to 2012. Electricity prices continued to be regulated at a stable level between 50 to 100 KRW/kWh during the same period. However, natural gas prices continued to climb because the prices of other fuels are determined by the market. Natural gas prices and electricity prices reversed around 1997. The seasonal trend reversal, as described in Figure 5 in Section 2.B., could be a result of a switch in the heating fuel choice from natural gas to electricity4 by the operators of commercial buildings.
FIGURE 8.
ELECTRICITY PRICES AND NATURAL GAS PRICES IN COMMERCIAL SECTOR (1991-2012)
Source: Korea City Gas Association; Electric Power Statistics Information System.
Therefore, our focus here is on the commercial sector, which experienced a major increase in the consumption share and a price decline at the same time during 1991 and 2012. We analyze the effects of price and the relative price of electricity on consumption in the commercial sector in Section 3.
III. Assessment Model
In this study, we established a model which estimates monthly electricity consumption in the commercial sector during the years of 1991-2012. Our estimation model is specified in equation (2), similar to Contreras, Smith, and Fullerton (2011), who analyzed the impacts of weather variables, HDD and CDD, on commercial electricity demand in the United States.
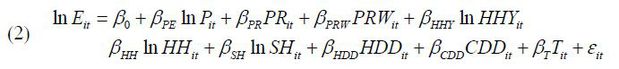
In equation (2), E represents the consumption of electricity in sector i at time t . i is the commercial sector in this paper. HDD and CDD are heating degree days and cooling degree days, respectively. In Contreras, Smith, and Fullerton (2011) and in Denton, Mountain, and Spencer (2003), the statistical impacts of the prices and the relative prices of electricity were evaluated. Following them, we employ two price variables, the electricity price ( P ) and the price ratio of electricity to natural gas ( PR ).5 PRW is the interaction term for PR and heating degree days ( PRit × HDDit ), which measures the impact of the relative price of electricity to natural gas on the heating load in winter.6 In Korea, people have stressed the importance of the price of electricity relative to that of natural gas in wintertime. However, to the best of our knowledge, only a few empirical studies have estimated its impact. Therefore, both PR and PRW are included in the explanatory vector to calculate the impact of the price ratio between natural gas and electricity in our study.
Fell et al. (2011) and Qiu (2014) argued that an instrumental variable approach should be used to avoid the endogeneity bias associated with price variables. In the present study, we ignore the endogeneity issue because electricity prices are predetermined in Korea by the government. We are not the first to use this strategy, but some studies have ignored the potential price endogeneity issue (Newell and Pizer 2008; Andrews and Krogmann 2009a; 2009b).
The inclusion of income variables is very common in the literature on electricity consumption. To measure the income effect, we use household income ( HHY ). HH and SH denote the numbers of households and the share of single person households, respectively. These variables will capture the impact of changes in household characteristics on electricity demand.
One factor driving the electricity load is the increase in the proportion of single-person households. Many of these consumers live in commercial office buildings, which are exempt from progressive taxes and allow residents to enjoy the modern city lifestyle. A greater number of single-person households will mean a larger number of commercial office buildings and higher per capita electricity consumption. In Korea, the share of single households increased from 9% in 1991 to 24% in 2012, and this rate of growth has increased rapidly in recent years. Lastly, T denotes the year, a trend variable, and Ɛit is the disturbance term.7 The basic descriptive statistics are presented in Table 5.
IV. Results and Robustness Test
The estimation results are summarized in Table 6. A Prais-Winsten regression (Prais and Winsten, 1954) is adopted to control for heteroscedasticity associated with serially correlated errors. The Durbin-Watson statistic demonstrates that the Prais-Winsten method successfully controls the AR (1) process of error terms.
As shown in column (1) in Table 6, when either CDD or HDD increases by one unit, the electricity demand increases by 0.007 percent. As expected, summer heat and winter cold, represented by CDD and HDD, increase the corresponding levels of electricity demand.
TABLE 6
RESULTS FROM ORDINARY LEAST SQUARE (OLS) AND PRAIS-WINSTEN ESTIMATION TESTS
Note: Robust standard errors in parentheses; *** p<0.01, ** p<0.05, *p<0.1.
The estimated coefficient of ln Pit( ) represents price elasticity in the commercial sector (-0.602). This indicates that
the level of electricity demand is price responsive in the commercial sector and that
the price elasticity of electricity demand is expected to be negative, as the law
of demand dictates. This effect should have no endogeneity bias (or simultaneity bias).
The price of electricity in Korea can be considered as exogenous because it is provided
through regulated fixed tariffs based on anticipated operation and fuel costs.
) represents price elasticity in the commercial sector (-0.602). This indicates that
the level of electricity demand is price responsive in the commercial sector and that
the price elasticity of electricity demand is expected to be negative, as the law
of demand dictates. This effect should have no endogeneity bias (or simultaneity bias).
The price of electricity in Korea can be considered as exogenous because it is provided
through regulated fixed tariffs based on anticipated operation and fuel costs.
While measures the own-price elasticity of demand when other things are constant,8  indicates the cross-price elasticity, measuring the effect of relative prices between
natural gas and electricity. The results show that s not statistically significant. However, the relative price during the winter months
has a statistically significant negative effect on electricity demand (
indicates the cross-price elasticity, measuring the effect of relative prices between
natural gas and electricity. The results show that s not statistically significant. However, the relative price during the winter months
has a statistically significant negative effect on electricity demand (  ). The significant estimator implies that demand has been responsive to changes in
relative fuel prices in winter months and the negative sign indicates that the level
of demand increases when the electricity price is relatively low compared to that
of natural gas in the winter months. These findings support our assumption that the
peak demand during the winter months in Korea can be attributed to the price difference
between electricity and its substitutes.
). The significant estimator implies that demand has been responsive to changes in
relative fuel prices in winter months and the negative sign indicates that the level
of demand increases when the electricity price is relatively low compared to that
of natural gas in the winter months. These findings support our assumption that the
peak demand during the winter months in Korea can be attributed to the price difference
between electricity and its substitutes.
On the other hand, the total price effect has two components: (i) the (direct) absolute
effect ( ), and (ii) the (indirect) relative effect with respect to the prices of competing
products,  , when the partial derivative of the electricity price is given by
  .9 Table 7 shows the change in the total price effect on the two periods before and after 2002.
As the price of electricity relative to that of natural gas decreased in the second
period,10 the total price effect decreased from 0.72 to 0.66 during the same period. This result
demonstrates the importance of relative energy prices in determining electricity demand.
In Korea, the retail price of natural gas is regulated by local governments, but wholesale
prices supplied by the Korea Gas Corporation reflect the international fuel price
through the mechanism of fuel-electricity price linkage. On the other hand, the linkage
mechanism has scarcely been implemented in determining the price of electricity. The
electricity price is a major component of price-stabilization measures that have taken
up a higher position than the fuel-electricity price linkage mechanism in Korea’s
policy domain. As a result, the difference between the two prices has increased, as
described in Figure 8.
.9 Table 7 shows the change in the total price effect on the two periods before and after 2002.
As the price of electricity relative to that of natural gas decreased in the second
period,10 the total price effect decreased from 0.72 to 0.66 during the same period. This result
demonstrates the importance of relative energy prices in determining electricity demand.
In Korea, the retail price of natural gas is regulated by local governments, but wholesale
prices supplied by the Korea Gas Corporation reflect the international fuel price
through the mechanism of fuel-electricity price linkage. On the other hand, the linkage
mechanism has scarcely been implemented in determining the price of electricity. The
electricity price is a major component of price-stabilization measures that have taken
up a higher position than the fuel-electricity price linkage mechanism in Korea’s
policy domain. As a result, the difference between the two prices has increased, as
described in Figure 8.
We also found that the increase in the number of households has increased the demand for electricity by 11.83 percent ( HH ). Electricity consumption becomes larger with an increase in household income ( HHY ) by nearly 0.4 percent. Other characteristic variables such as the share by single person households ( SH ) are not statistically significant in this study.
Because the unit root and the spurious regression problem have been accounted for in times series data of electricity consumption, unit root tests are performed to check for non-stationary behavior. The well-known standard ADF (Augmented-Dickey-Fuller) test is applied in this study. The T-test statistic for the lagged value of commercial electricity consumption is -3.084 and the p-value is 0.0277. Because the test statistic is smaller than the critical value of the confidence level at 5% (-2.879), electricity demand in the commercial sector allows us to reject the unit root null hypothesis at the 5% significance level, meaning that electricity demand in the commercial sector is stationary in Korea.
V. Conclusion
Given the global interest in climate change, the impacts of weather variations on electricity demand and greenhouse gas (GHG) emissions have been discussed in many countries. At the Paris meeting in 2015 (COP21), Korea reset the target for its GHG emissions, targeting a 37 percent change from the business-as-usual (BAU) measure by 2030. To achieve this reduction, demand management in the power sector is a must given that the proportion of the power sector emissions to those at the national level exceeded 40 percent in 2013. However, electricity demand in Korea has increased over time and a reduction in GHG emissions by the power sector appears to be a mere hope that can never be reached.
In the present study, we investigate factors that cause increments in load levels and test whether or not electricity policies, specifically the price policy, are set to comply with Korea’s mitigation target. Using statistical tests, we provide empirical evidence that temperatures have increased over time in Korea. When we take the temperature impact on electricity demand into account, the winter load for heating should have decreased while the summer demand for cooling should have increased. Opposite to this expectation, the winter demand level has dramatically increased over time.
Few empirical studies have investigated the impacts of climate change and price variation on electricity demand levels in Korea. We attempt to fill this gap in the literature by employing an econometric model and quantifying both the effects of weather variations in terms of temperature and price factors on the demand for electricity. After controlling for the effects of GDP growth and changes in populations and family types on electricity demand, we find statistically significant contributions of temperature changes and electricity prices on electricity demand. Our analysis finds that the consumption increase of electricity of the commercial sector in wintertime is the result of relatively low electricity prices compared to the prices of its substitute heating energy source, which is natural gas.
Our empirical finding calls for a policy change regarding electricity prices to achieve the GHG reduction goals announced by the international society. Furthermore, relative prices are likely to have an impact on summer electricity demand, as well as winter electricity demand, in the future because there is no adequate alternative fuel source for cooling demand in summertime. There is a high possibility of summer peaks arising with abnormal increases in both temperature and income levels. This conclusion stresses the importance of the relative prices of energy sources contributing to the mitigation of GHG emissions in the future.
Notes
The annual growth rate of average winter load during winter months was 7.83 percent from 1991 to 2012, which was larger than that of the average summer load (7.17 percent). For more detailed information about growth rates by sector, see Table 1.
Weather records prior to 1973 are available but have very limited accuracy, with missing values. For this reason, they are not analyzed here.
Ministry of Knowledge Economy (later, the Ministry of Trade, Industry and Energy), Press Release, January 12, 2011 (http://www.motie.go.kr/motie/ne/rt/press/bbs/bbsView.do?bbs_seq_n=65872&bbs_cd_n=16).
We propose the hypothesis which holds that due to the extremely low price of electricity and Korea’s preference for floor heating, hot water mats and electric heating mats have become competitors in the heating market.
One way to measure winter demand (=heating demand) for electricity is to use a monthly dummy variable indicating winter (December, January and February). However, considering that heating demand can occur in November and March as well as in December, January and February, the HDD variable, a measure of the degree of demand, is used to represent the relative price of heating demand in winter.
Variables representative building characteristics are employed in some studies. For example, Otsuka (2015) analyzed the commercial sector using panel data for the period of 1990–2010 in Japan. He attributed the demand of the commercial sector to an increase in commercial floor space and advances in office automation. Due to a lack of relevant data, we cannot include these variables in equation (1).
In general, the elasticity of demand for a product describes what happens when the price of the product changes, holding constant the prices of all other products.
 will be
 References
, & . (2009a). Explaining the adoption of energy-efficient technologies in US commercial buildings. Energy and Buildings, 41(3), 287-294, https://doi.org/10.1016/j.enbuild.2008.09.009.
, & . (2009b). Technology diffusion and energy intensity in US commercial buildings. Energy Policy, 37(2), 541-553, https://doi.org/10.1016/j.enpol.2008.09.085.
Bank of Korea. Bank of Korea, Economics Statistics System, https://ecos.bok.or.kr/EIndex-en.jsp.
, & . (1999). Elasticities of electricity demand in India. Energy Policy, 27(3), 137-146, https://doi.org/10.1016/S0301-4215(99)00011-7.
, , & . (2013). Seasonal temperature variations and energy demand. Climatic Change, 116(3-4), 805-825, https://doi.org/10.1007/s10584-012-0514-5.
, , & (2003). Energy demand with declining rate schedules: an econometric model for the US commercial sector. Land Economics, 79(1), 86-105, https://doi.org/10.2307/3147107.
Electric Power Statistics Information System, https://epsis.kpx.or.kr.
, , , & . (2012). Climate policy design with correlated uncertainties in offset supply and abatement cost. Land Economics, 88(3), 589-611, https://doi.org/10.3368/le.88.3.589.
, & . (2004). Elasticities of electricity demand in urban Indian households. Energy policy, 32(3), 429-436, https://doi.org/10.1016/S0301-4215(02)00314-2.
, & . (1998). Residential energy demand and the interaction of price and temperature: British experimental evidence. Energy Economics, 20(2), 157-171, https://doi.org/10.1016/S0140-9883(97)00025-X.
, & (2004). Residential electricity demand in Taiwan. Energy economics, 26(2), 201-224, https://doi.org/10.1016/j.eneco.2003.11.001.
, , , & . (2015). The effect of temperature on the electricity demand: An empirical investigation. Journal of Energy Engineering, 24, 167-173, in Korean, https://doi.org/10.5855/ENERGY.2015.24.2.167.
, , , & . (2016). Temperature Effects on the Industrial Electricity Usage. Environmental and Resource Economics Review, 25(2), 141-178, in Korean, https://doi.org/10.15266/KEREA.2016.25.2.141.
Korea City Gas Association. Korea City Gas Association, http://www.citygas.or.kr/info/charge.jsp.
Korea Electric Power Corporation. Korea Electric Power Corporation, http://home.kepco.co.kr/kepco/EN/main.do.
Korea Meteorological Administration. Korea Meteorological Administration, http://web.kma.go.kr/eng/index.jsp.
, & . (2010). The impact of extreme weather events on budget balances. International Tax and Public Finance, 17(4), 378-399, https://doi.org/10.1007/s10797-010-9144-x.
, & . (1996). Residential energy demand analysis: an empirical application of the closure test principle. Empirical Economics, 21(2), 203-220, https://doi.org/10.1007/BF01175970.
, , & . (2008). Climate change adaptation: A study of fuel choice and consumption in the US energy sector. Journal of Environmental Economics and Management, 55(2), 175-193, https://doi.org/10.1016/j.jeem.2007.10.001.
Ministry of Knowledge Economy. Ministry of Knowledge Economy, Press Release, 2011, January, 12, http://www.motie.go.kr/motie/ne/rt/press/bbs/bbsView.do?bbs_seq_n=65872&bbs_cd_n=16.
, & (2008). Carbon mitigation costs for the commercial building sector: Discrete–continuous choice analysis of multifuel energy demand. Resource and Energy Economics, 30(4), 527-539, https://doi.org/10.1016/j.reseneeco.2008.09.004.
, , & . (2002). Temperature and seasonality influences on Spanish electricity load. Energy Economics, 24(1), 55-70, https://doi.org/10.1016/S0140-9883(01)00082-2.
, & (1997). Short and long-run elasticities in US residential electricity demand: a co-integration approach. Energy economics, 19(4), 493-513, https://doi.org/10.1016/S0140-9883(97)01027-X.
Statistics Korea. Statistics Korea, National Population and Housing Census, http://kostat.go.kr/portal/eng/pressReleases/8/1/index.board.
. (2014). Energy efficiency and rebound effects: an econometric analysis of energy demand in the commercial building sector. Environmental and Resource Economics, 59(2), 295-335, https://doi.org/10.1007/s10640-013-9729-9.
. (2000). Heating technology and energy use: a discrete/continuous choice approach to Norwegian household energy demand. Energy Economics, 22(6), 649-666, https://doi.org/10.1016/S0140-9883(00)00053-0.
. (2003). Functional forms in energy demand modeling. Energy Economics, 25(6), 603-613, https://doi.org/10.1016/S0140-9883(03)00043-4.