- P-ISSN 2586-2995
- E-ISSN 2586-4130

Using the Census on Establishments collected by Statistics Korea, we analyze how the patterns of job creation and destruction differ across counties (si-gun-gu). We measure aggregate employment changes due to establishment startups, expansions, contractions, and shutdowns for each county and quantify the role of such reallocations in explaining variation in employment growth across counties. Overall we find that both rates of net entry and job creation play an important role in explaining differences in net job creation rates across regions. Moreover, counties with high employment growth rates also tend to have high exit and job destruction rates, which suggests that an active process of job reallocation is a key source of regional employment growth.
Job Creation, Job Destruction, Entry and Exit, Regional Employment
E24, O47, R11
Employment growth is a key measure of a region’s economic performance. Using the Census on Establishments collected by Statistics Korea, we analyze how the patterns of job creation and destruction differ across counties (si-gun-gu in Korean). We measure aggregate employment changes due to establishment startups, expansions, contractions, and shutdowns for each county and quantify the role of such reallocations in explaining variation in employment growth across counties.
Recent studies focusing on the role of entry, exit, and job growth of incumbents find that entry is important in explaining regional employment growth. Going back at least to Schumpeter, reallocations among firms, termed “creative destruction,” have been viewed as a necessary part of economic growth. Economic growth models emphasizing the role of creative destruction explain the link between job reallocations and economic growth (Davis and Haltiwanger 1992; Davis, Haltiwanger, and Schuh 1998). Previous studies find substantial variation in job creation and destruction across regions (e.g., Faberman 2002; Bauer and Lee 2010) or countries (Bertola and Rogerson 1997; Mortensen and Pissarides 1999). According to these studies, there is a strong correlation between a region’s employment growth and job creation and destruction rates. In particular, Jarmin, Haltiwanger, and Miranda (2013) find that both the entry and growth of young firms are crucial for employment growth of an economy. In this paper, we quantify the importance of entry and exit of establishments in accounting for variation in employment growth across counties.
We use establishment-level data from the Census on Establishments from 2001 to 2011 in order to examine the role of entry, exit, job creation, and destruction in explaining variation in employment growth rates across regions. Through investigating job creation and destruction patterns across geographic regions in Korea, this paper sheds light on issues related to the entry regulation and employment growth. By analyzing cross-regional variation in the job reallocation process, we can examine the role of firm dynamics in explaining regional employment growth.
While a number of studies examined the entry and exit of establishments and job creation and destruction patterns since the early 2000s, most have focused on the manufacturing sector (Kim 2004; Kim and Yoon 2011). Considering the decline in manufacturing and its share in aggregate employment, our study makes a meaningful contribution by examining the role of job creation and destruction in the service sector (Chun and Lee 2013). Given that most service industries are based at specific regions, understanding job creation and destruction patterns across regions is essential to understand the dynamics of service sector employment.
In section II, we introduce data and key measures. We examine job creation and destruction patterns at the province (si-do in Korean) level in section III and at the county level in section IV. In section IV, we also quantify the role of entry and exit as well as job creations and destructions in explaining the variation of employment growth rates across counties. We conclude in section V.
We use the Census on Establishments collected by Statistics Korea from 2001 to 2011. The Census on Establishments is an annual survey encompassing all establishments in Korea.2 A business establishment, a unit of business at a single physical location that produces or distributes goods or provides services, is a unit of observation in the dataset.
In this study we follow OECD’s DynEmp project (Criscuolo, Gal, and Menon, 2014) and Hwang et al. (2009) in classifying the service sector. In our paper, we exclude the following industries: Agriculture, forestry, and fishing (01∼03; KSIC rev. 9 Code), Mining (05~08), Electric, gas, steam and water supply (35~36), Sewerage, waste management, materials recovery and remediation activities (37~39), Construction (41~42), Activities of households as employers (97~98), and Activities of extraterritorial organizations and bodies (99). After excluding the aforementioned industries, we label all industries except Manufacturing (10~33) as Services.
The purpose of this study is to examine the patterns of job creation, destruction, and net employment growth across geographic regions. The concepts of aggregate measures of job creation rates, job destruction rates, and net job creation rates are described in this section. We construct aggregate measure of job flows at the province level (major cities and provinces) and at the county level. The most basic concept is job creation, in which the number of employment of an establishment increases and job destruction, in which the number of employment of an establishment decreases.
First, we construct Gross Job Creation, Cj ,t and Gross Job Destruction, Dj ,t for each region j as follows:
Here, ΔEi,j,t = Ei,j,t − Ei,j,t-1 measures changes in employment between t and t − 1 at establishment i and region j . The superscripts + and − in S refer to expanding and contracting establishments, respectively. Note that gross job creation includes job creation from births of new establishments and gross job destruction from deaths of existing establishments. For example, employment of an entering (birth) establishment i at t − 1 would be 0(i.e., Ei,j,t-1 = 0) and employment of exiting (death) establishment i at t would be 0 as well (i.e., Ei,j,t = 0). We will separately examine job creation (destruction) from birth (death) and job creation (destruction) from continuing establishments. An entrant (birth) is defined as an establishment that starts an economic activity at a given region (county) in a given industry, the classification of which is based on 2-digit industry classification. For instance, if an establishment changes its main activity from shipbuilding to automobile manufacturing, we consider it as a birth in automobile manufacturing and a death in shipbuilding manufacturing. An exit (death) is defined as an establishment that terminates an economic activity at a given region (county) in a given industry, the classification of which is based on county-level geographic classification. For instance, if a store moves from Gangnam-gu to Mapo-gu, we consider it as a birth in Mapo-gu and a death in Gangnam-gu.3
Employment growth rate, gi,j,t , for an establishment i in region j at time t is defined as follows, in which the establishment size is based on the average between t and t−1, (i.e., Xi,j,t = (Ei,j,t + Ei,j,t-1) / 2).
We follow Davis, Haltiwanger, and Schuh (1998) to calculate weighted average of employment growth rate for a given group s , based on each industry in region j :
where the average size of establishments in a region j is the sum of average size of establishments in each group.
Based on gross job creation and destruction derived above, we measure gross job creation rate, JCRj ,t , and gross job destruction rate, JDRj ,t . Gross job creation (destruction) rate is obtained by dividing gross job creation (destruction) by the average size of establishments in each region j .
Net job creation rate, NJCj ,t , is obtained using the gross job creation and destruction rates as follows.
Finally, gross job reallocation rate, GJRj ,t , and excess job reallocation rate, EJRj ,t , are given by the equations below.
In this section, we describe net employment growth and job creation and destruction patterns across 7 major cities and 9 provinces. For notational purpose we hereafter refer to major cities and provinces as provinces. We also examine the differences in employment growth between manufacturing and service sectors through comparing job creation and destruction patterns.
Table 1 and Figure 1 report job creation, job destruction, and net job creation rates by province, for all industries, manufacturing, and services, respectively. The map in Figure 1 exhibits net job creation rates by province for manufacturing and service sectors. In the Panel A of Table 1, Gyeonggi shows the highest net job creation rate of 4.4% while Jeonnam has the lowest at 1.1%. In the case of manufacturing in Panel B, Seoul shows the largest decline of net job creation rate of –5.7%, while Chungnam shows the highest growth of 5.4%. Major cities such as Seoul, Busan, Daegu, and Incheon all show negative net employment growth in manufacturing. In the service sector, Gyeonggi (5.3%) and Ulsan (3.6%) show the highest employment growth rates.
It is worth noting that in most provinces, the job creation and destruction rates are much higher than net job creation rates. This finding suggests that there has been very active reallocation in most areas. Moreover, job creation and destruction rates are generally higher in areas with higher net job creation rates such as Seoul and Gyeonggi. In fact higher net employment growth rates involve not only higher job creation rates but also higher job destruction rates. We examine this pattern by using county-level data in more detail in section IV.
Table 2 breaks down job creation and destruction rates into job creation by continuing establishments vs. entrants and job destruction by continuing establishments vs. exiters. In all major cities and provinces, job creation rates for entrants are higher than those for continuing establishments. Job destruction rates of exiters are also higher than those of continuing establishments as well.4 In other words, most job creation and destruction activities are accounted for by job flows among entering and exiting establishments. Moreover, job creation and destruction rates for continuing establishments do not show a substantial variation across regions.
In order to examine differences in entry and exit rates across regions, Table 3 reports entry, exit, and net entry rates by province for all industries. As discussed earlier, both entry and exit play an important role in explaining job creation and destruction. In the case of all industries, Gyeonggi shows the highest net entry rate (3.6%). With the exception of Ulsan with net entry rate of 2.1%, Gyeonggi’s net entry rate is substantially higher than those in other provinces. The entry rate of Gyeonggi is also the highest at 25.2%.
Note that provinces with higher entry rates have higher exit rates as well. In fact, entry and exit rates are highly correlated, suggesting that higher job creation rates due to entry is likely to accompany higher job destruction rates due to exit. While high correlation between entry and exit rates and job creation and destruction rates across regions are well documented in studies from other countries (e.g., Lee, 2008), this study confirms such a relationship between entry and exit also holds in the case of Korea.
Evidence from the previous section suggests that provinces with higher employment growth rates have higher net entry rates than those with lower employment growth rates. Moreover provinces with higher employment growth rates tend to have higher job destruction rates as well as higher job creation rates. Now, we examine the extent to which job reallocations account for variation in employment growth across provinces by analyzing job creation and destruction patterns at the more detailed geographic level, county (or si-gun-gu). First, we quantify the role of job creation and destructions in explaining the variation in employment growth rates across counties. Then, we perform a regression analysis to examine the role of entry, exit, net entry, job reallocation, and excess reallocation in employment growth. We consider the size of population, population flow, and the number of establishments, as emphasized by Acs and Armington (2006) and Hur (2007) as factors in the regression, as well.
Table 4 reports the number of counties in each province and the summary statistics of the number of establishments and employment for counties in each province. There are 249 counties in the sample and Gyeonggi (44) has the largest number of counties. A county in Seoul has on average about 27,000 establishments and about 132,000 workers, suggesting that the size of a county in Seoul is on average larger than counties in other provinces.
Note: Numbers in the right two columns are county-level averages of the number of establishments and employment for each province. Numbers in parentheses are standard deviations.
While we do not report all statistics at the county level due to space constraints, we find that net job creation rates across counties show larger variation than those observed among provinces in Table 1. For example, the net job creation rates vary from 14.9% in city of Hwasung in Gyeonggi to −1.0% in Dong-gu, Gwangju and city of Masan in Gyeongnam.
Table 5 reports summary statistics for job creation rates, job destruction rates, and net job creation rates for entering, exiting, and continuing establishments, respectively. Overall net job creation rates for continuing establishments are on average negative for all industries, manufacturing, and services. On the other hand, net job creation rates for entrants and exiters are positive and show higher standard deviation, which suggests that both entry and exit play an important role in employment growth. While such a pattern is observed both in manufacturing and services, the average net job creation rate for entrants and exiters is higher in services (2.6% in services versus 0.5% in manufacturing).
Figure 2 shows the distribution of job creation rates of continuing establishments and entering establishments. While job creation rates of continuing establishments are concentrated around 10%, job creation rates of entering establishments show much wider variation. Similarly, Figure 3 presents the distribution of job destruction rates for continuing establishments versus exiting establishments. Job destruction rates for exiters exhibit a wider variation that those for continuing establishments. The finding from the figures suggests that job creation by entrants and job destruction by exiters are more important factors than job flows among continuing establishments in explaining variation in employment growth rates across counties.
To examine the extent to which job creation and destruction rates explain the variation of net employment growth rates across counties, we decompose the variance of employment growth rates across counties (Lee 2011).
First, in order to quantify the effect of job creation and destruction from entry and exit versus those from continuing, we decompose the variance of net job creation rates as follows. Similarly, net job creation rates can be decomposed into job creation rates and job destruction rates.
In the equation above, r denotes a county and netjcr denote net job creation rates for the county. The net job creation rate can be decomposed into that associated with entry and exit, enex _ netjcr and that with continuing establishments, con _ netjcr . In the second row of the equation, net job creation rate can be rewritten as job creation rate, jcr minus job destruction rate, jdr .
The variance of net job creation rates can be decomposed as follows.
This decomposition is equivalent to examining the coefficients from independently regressing “net job creation rates for entrants and exiters” and “net job creation rates for continuing establishments,” respectively, on net job creation rates. The results of this decomposition point to the importance of each component in accounting for differences in employment growth rates across counties. Table 6 reports the results of the decomposition for all industries, manufacturing, and services. On average, net job creation rates for entrants and exiters account for about 82% of variations in employment growth in all industries across counties. The remaining 18% is accounted for by net job creations by continuing establishments. While the role of net job creations by entry and exit is somewhat smaller in manufacturing (72%), it is larger in services (89%). This finding is consistent with those from other studies that entry and exit generally play more important roles in employment growth in service sectors than in manufacturing.
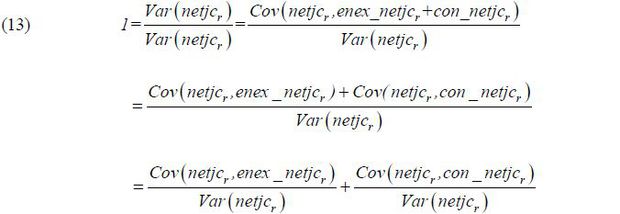
In a similar way, the variance of net job creation rates can be decomposed as the covariance with job creations and job destructions as follows.
The results of Table 7 show that the variation in job creation rates is much more important in explaining differences in employment growth rates across counties in all industries. In the case of manufacturing, however, job destruction rates account for virtually all the differences in employment growth rates across counties. This is in sharp contrast to services in which differences in job creation rates account for more than 150% of the variation in employment growth rates.
In a study examining the differences in employment growth rates across regions, Hur (2007) finds that net population flows and taxes are important factors in explaining the variation. This study focuses on the role of dynamics such as entry, exit, job creation, and job destruction. Under the hypothesis that job reallocations as well as entry and exit are closely related to employment growth, we examine five important dynamics measures: entry rate, exit rate, net entry rate, job reallocation rate, and excess reallocation rates. In addition, the regression equation includes the number of establishments and population to control for differences in the region’s size:
In the equation above, netjcr is the net job creation rate of county r and Dynr represents the five variables of the dynamics. Zr denotes county-specific characteristics such as county-level population, population flows, number of establishments, and province dummies.
The results of the regressions are reported in Tables 8-10 for all industries, manufacturing, and services, respectively. In Table 8, while all measures of dynamics are positively correlated with net employment growth rates, in all industries, entry has higher coefficients than exit does. Moreover, the coefficient of net entry is close to one, suggesting that net entry rates account for most changes in net job growth rates. Finally, we find that net population inflows are also positively correlated with net job changes.
Note: Standard errors are in parentheses.
*** Significant at the 1% level. ** Significant at the 5% level. * Significant at the 10% level.
It is worth noting some difference between the manufacturing and the service industry in the effects of dynamics on net job creation rates. In the case of manufacturing, the result of which is reported in Table 9, we find that exit rates are negatively correlated with net job creation rates. While the directions of correlations are opposite for entry and exit rates, the magnitudes are similar. Moreover, job reallocation rates and excess reallocations are not significantly correlated with net job creation rates. In the case of services, the results in Table 10 are similar to our finding for all industries. While all dynamics variables are positively correlated with employment growth rates, the coefficients are higher for entry and net entry. We also find that net population inflows, job reallocation rates and excess reallocation rates are positively correlated with net job creation rates.
In this paper we analyzed establishment-level data from the Census on Establishments to examine the patterns of entry, exit, job creation, and destruction and their roles in explaining variation in employment growth rates across counties in Korea. Overall both net entry and job creation play an important role in explaining differences in net job creation rates across counties. However, a high entry and job creation does not come without a cost. Most counties with higher growth rates also tend to have higher exit and job destruction rates. Overall an active process of job reallocations promotes employment growth, particularly in growing industries such as those in the service sector.
While this paper focuses on the role of firm dynamics measured in terms of entry and exit, further studies are necessary to understand the effect of differences in the industry composition and the characteristics of a county, such as human capital, population, and size distribution of firms. Industry composition needs to be considered because job creation and destruction rates vary across industries. While job creation and destruction rates are generally lower in manufacturing, they are expected to be much higher in construction and in some service industries such as professional, scientific and technical services or administrative and support. Moreover, it would be important to understand the relationship between industries in terms of employment growth. Future studies examining spillover effects between manufacturing and related service industries will help understand such dynamics in regional employment growth.
While some studies (Hopenhayn and Rogerson 1993) focus on the differences in labor market policy (such as firing costs and unionization), we do not expect that there exists a substantial difference in labor market policies across regions in Korea. In contrast, differences in age and size distribution of firms may drive some of differences in job creation and destruction rates across counties. Both theoretical and empirical studies on industry dynamics suggest that young or small firms are more likely to grow (Jovanovic 1982; Dunne, Roberts, and Samuelson 1989). Davis, Haltiwanger, and Schuh (1996) also find that job creation and destruction rates are higher for smaller or younger establishments. We intend to investigate the role of firm age and size associated with labor market policies in the regional job reallocation process in future work.
We thank Kyungsoo Choi (the editor), Jiyoon Oh, and participants at the Symposium of the KDI Journal of Economic Policy for their helpful suggestions and Hongjun Kim for excellent research assistance. We also thank Statistics Korea and the Korea Statistics Promotion Institute for allowing us access to the data used in this paper in a secure data center. All results have been reviewed to ensure that no confidential inf ormation is disclosed. This work was supported by the National Research Foundation of Korea Grant funded by the Korean Government (NRF-2013S1A3A2053312) and the Sogang University Research Grant of 2013 (201310066).
In addition to the establishment ID, we use the business register and other information in order to link establishments over time. Establishments lacking such information as well as those with frequent entry and exit in a short time period are dropped from the sample. Moreover, by reporting average across sample years, we minimize measurement errors in entry and exit each year.
, & (1997). Institutions and Labor Reallocation. European Economic Review, 41(6), 1147-1171, https://doi.org/10.1016/S0014-2921(96)00048-7.
, & (1992). Gross Job Creation, Gross Job Destruction, and Employment Reallocation. Quarterly Journal of Economics, 107(3), 819-863, https://doi.org/10.2307/2118365.
, , & (1996). Small Business and Job Creation: Dissecting the Myth and Reassessing the Facts. Small Business Economics, 8(4), 297-315, https://doi.org/10.1007/BF00393278.
, , & (1989). The Growth and Failure of US Manufacturing Plants. Quarterly Journal of Economics, 104(4), 671-698, https://doi.org/10.2307/2937862.
, & (1993). Job Turnover and Policy Evaluation: A General Equilibrium Analysis. Journal of Political Economy, 101(5), 915-938, https://doi.org/10.1086/261909.
, , & (2013). Who Creates Jobs? Small vs. Large vs. Young. Review of Economics and Statistics, 95(2), 347-361, https://doi.org/10.1162/REST_a_00288.
(1982). Selection and the Evolution of Industry. Econometrica, 50(3), 649-670, https://doi.org/10.2307/1912606.
. (2008). Geographic Redistribution of US Manufacturing and the Role of State Development Policy. Journal of Urban Economics, 64(2), 436-450, https://doi.org/10.1016/j.jue.2008.04.001.