
Testing Solow’s Implications on the Effective Development Policy
Abstract
The core of the neoclassical growth theory is the capital investment. Solow proposed that the diminishing return is key to such growth process in establishing the stability of the equilibrium growth path. This key postulation has critical implications on the sustainable and effective development policies, emphasizing the importance of productivity growth not only for the steady-state growth but also for the transitional growth from capital accumulation. This paper suggests a novel way to test the diminishing return, the backbone assumption of Solow model, and confirms its strong presence using the Penn World Tables version 8.0 data, hence validates Solow's implications on effective development policies.
Keywords
Capital Accumulation, Diminishing Return, TFP, Development Policy, Development Effectiveness, 자본축적, 수확체감의 법칙, 총요소생산성, 개발정책, 개발효과성
JEL Code
O11, O15, O47
Ⅰ. Introduction
Classic debates on economic growth can be traced back at least to Malthus (1798) who explained why individual standard of living did not improve for most of the human history in relation to the endogenous population dynamics despite the growth of total output. However, since the Industrial Revolution when the output per capita started to grow and the positive growth continued for about two centuries, various models were proposed to explain the possible mechanisms of such sustainable growth. One of the pioneering models of economic growth was the theory proposed by Harrod (1948) and Domar (1946). Although their works have independent components, the main message of Harrod (1948) and Domar (1946) was basically common, emphasizing the importance of capital accumulation for sustainable growth, and their models gained the name of Harrod-Domar model. This model was well received as the benchmark growth model and most growth and development policies in fact emphasized the promotion of investment in capital for sustainable growth. Kaldor (1956, 1957) enriched Harrod-Domar type of growth model by suggesting that there is a positive relationship between the income level and the savings rate, hence the investment rate.
Combining the implications of Harrod-Domar and Kaldor models, the lack of growth in poor countries, where the income levels are close to subsistence income, can be explained simply by the low savings rate, hence low or no investment in capital. Thus, appropriate policies to help the poor economies to escape from the poverty were to be related to delivering funds for capital investment or for consumption to relax the savings constraints. Such policies, which relax the savings constraints, were expected to contribute to developing the poor countries. This logic of development aid based on Harrod-Domar and Kaldor models sounds reasonable. This indeed was the basis of many foreign aid policies since the concept of the Official Development Assistance (ODA) was born after the Second World War, and massive ODA fund were delivered to many developing countries, particularly to Africa. This was the basis also of national development policies such asforced savings.
However, as we observed for the last six decades of such massive development aid, virtually no or only very low growth happened in most of the poor countries that received such development aid. In particular, among the Sub-Saharan African countries, the per capita income growth was literally zero or negative since 1960s with some exceptions such as Botswana and Mauritius, and only recently some African countries started to show the possibilities of rapid growth. There are many possible reasons for this failure of development aid, the so-called "aid fatigue," including corruption, political instability, civil wars, lack of infrastructure and institutions, wrong policies, bad luck, geographic disadvantages, and so on. Acknowledging the importance of all these factors, this paper attempts to call attention to a more fundamental force which prevents the capital investment without productivity growth from being a source of sustainable growth, i.e., the diminishing return. The diminishing return is the backbone assumption of Solow model, which became a benchmark theory for economic growth, and has been taken for granted for long without being subject to serious empirical tests. This paper suggests a novel way of testing the presence of diminishing return without explicitly formulating the aggregate production function, and brings the test method to the Penn World Tables version 8.0 data that is released just recently. This version of PWT data improved on measuring capital stock across countries, which helps us to utilize our method of test.
Obviously capital investment is one of the core mechanisms of growth. Actual development experience of the success countries indeed involved the active process of capital investment. This paper does not deny such importance of capital accumulation for growth. However, Solow forcefully suggested that the growth solely based on capital accumulation cannot be sustained in the long run, when there exists a force of diminishing return. Furthermore, with low productivity growth, the process of capital accumulation will happen only slowly even during the transitional growth period. Therefore, productivity matters in promoting growth in both short and long runs. We can infer these crucial implications for effective development only from the presence of diminishing return.
The paper is organized as follows. Section Ⅱ overviews brief history of the evolution of neoclassical growth models and illuminates the essential roles of diminishing return in Solow model. Section Ⅲ tests the presence of diminishing return utilizing the empirical relationship between output-capital ratio and investment rate as is implied from the Solow model. Section Ⅳ discusses the implications on the effective development policies from the empirical findings. Section Ⅴ concludes.
Ⅱ. Evolution of Perspectives on Capital Accumulation
1. Determinants of Income Growth of Harrod-Domar Model
The fundamental thoughts of Harrod (1948) and Domar (1946) on economic growth can be summarized by the following aggregate identity relationships


where Y denotes the aggregate output, K the aggregate capital, I the investment of capital, ν the output-capital ratio, λ the investment rate, and δ the depreciation rate of capital. The equation (3) shows the law of motion of capital (which is an accounting identity of capital investment), where ∆K denotes the net changes in capital and δ the depreciation rate. Then, the implied growth rate of aggregate output gY and the growth rate of aggregate capital gK are given by
 = νλ − δ.
Suppose that the required labor per unit of output falls at the rate of x and the population grows at the rate of n. Then, the total output grows at the rate of x + n. To compromise the above two ways of finding growth rate of aggregate output, the following equilibrium or consistency condition should hold

Main assumption of the Harrod-Domar model consists of the constancy of the output-capital ratio and investment rate, which were based on empirical observations of their period.
According to this model, there are two ways of expressing the growth rate of per capita income gy such that

or

Equation (5) expresses the income growth from the capital side, while equation (6) does from the labor side. Harrod and Domar focused on the capital-side equation (5), which suggests that income growth increases in the investment rate λ and it can be positive as long as the investment rate is high enough such that
 .
.
At the same time, zero or negative income growth is also possible when the investment rate is low enough. Note that either positive or negative, the income growth determined by the equation (5) lasts forever as long as the equilibrium condition in (4) is satisfied. Thus, any policy measures that raise the investment rate would increase the income growth rate permanently. This can be the basis of investment promotion policies to foster its own or other country’s national income growth.
2. Instability of Harrod-Domar System
Harrod and Domar could explain the determinants of economic growth in a simple and straightforward way as above in equation (5) and the influence of their model was substantial in thinking about national economic growth issues. It was so until an interesting feature of the model was noticed as follows. Suppose that the income growth rate of an economy is gy,0 = νλ0 − δ − n with investment rate of λ0. Suppose that a policy measure is implemented to increase the investment rate from λ0 to λ1 > λ0 (either by requiring domestic forced savings or receiving foreign aid for investment fund) so that the growth rate would increase from gy,0 = νλ0 − δ − n to gy,1 = νλ1 − δ − n. Suppose the economy was in equilibrium path with the initial investment rate, i.e., νλ0 − δ = x + n. Then, with the new investment rate λ0, the economy is in the out-of-equilibrium path because νλ0 − δ > x + n. This inequality can be re-arranged such that n < νλ1 − δ − x = gY,1 − gy = gE, where gY,1 = νλ1 − δ denotes the aggregate output growth rate under the investment rate λ1 and gy = x is the falling rate of labor input requirement per output, hence gY,1 − gy is the growth rate of employment or the labor demand, denoted by gE. Thus, under the new investment rate, the labor demand grows faster than the labor supply because gE > n, and the economy will be in this expanding out-of-equilibrium path forever and the excess demand for labor would increase indefinitely. With any negative investment shocks (such as natural disasters destroying the domestic capital stock or withdrawal of foreign aid for investment), the economy will in the ever-shrinking out-of-equilibrium path for the same reasoning but in opposite direction. That is, Harrod-Domar system is unstable to any exogenous changes in investment rate as well as to other shocks to all the rest parameters of the model. Thus, equation (5) is valid for income growth explanation only if the equilibrium or consistency condition (4) is precisely satisfied, which is rarely likely to hold. This is the so-called "knife-edge property" of Harrod-Domar model. Due to this knife-edge property and its instability, Harrod-Domar model looses its grip in explaining the actually observed income growth rates.
3. Solow’s Correction
The main reason Harrod-Domar model suffers from the above knife-edge property is that all five parameters in equilibrium or consistency condition (4) are unrelated to each other and are specified from a set of empirical relationships, hence there are no equilibrating forces in the Harrod-Domar model that restore the equilibrium to the external shocks. We need at least one parameter to be transformed into an endogenous variable that adjusts to external shocks. This is what Solow (1956, 1957) paid attention to and fixed the instability problem by installing a simple device as follows. Solow inherited most of the components of Harrod-Domar model, except that the output-capital ratio ν is turned into an endogenous variable rather than a given parameter. The simple mechanism that Solow suggested was diminishing return to capital investment. That is, fixing other inputs constant, returns to adding more capital diminishes as the level of existing capital stock increases. This is an intuitive concept for the accumulable production factors. Solow postulated this assumption and showed that only with this assumption the equilibrium growth path of the Harrod-Domar model becomes stabilized as follows. Suppose there is a positive shock to investment rate, i.e., λ increases from λ0 to λ1 > λ0, where the initial equilibrium growth path satisfies the condition νλ0 − δ = x + n. With this higher investment rate, available capital stock increases faster than before and the economy enters into the off-equilibrium growth path such that νλ1 − δ > x + n. The faster expansion of capital will contribute to increasing output growth. However, in the presence of diminishing return, marginal contribution of the increased capital to increasing output would become smaller along with the expansion of capital. In consequence, the output-capital ratio ν would decrease. This decrease will continue until the consistency condition is restored at a new value of output-capital ratio ν1 such that ν1λ1 − δ = x + n, hence the economy moves back to the equilibrium growth path.
This argument shows that the essence of diminishing return can be summarized by the negative relationship between investment rate and output-capital ratio such that

There are many interesting implications derived from this assumption of diminishing return for a growing economy. However, the most fundamental role of diminishing return is about giving the stability to the equilibrium growth path so that the concept of equilibrium becomes a useful tool in analyzing such a dynamic economic system. Solving the instability problem of the dynamic system of Harrod-Domar model, Solow model became a benchmark economic theory not only for the economic growth literature but also for many macroeconomic issues.
Ⅲ. An Empirical Test for Diminishing Return
1. Test Method
Solow’s another fundamental contribution to the economic growth theory is his proposal of the concept of "aggregate production function," which maps the set of aggregate quantities of inputs and the technological changes into the aggregate quantity of output Y such that
Where X is a vector of various kinds of inputs such as capital and labor, and time index t represents technological changes over time. This is a theoretical artifact that is used to articulate the idea of diminishing return and also to describe the relationship among aggregate variables in the equilibrium growth process subject to the diminishing return. In the context of the aggregate production function, the diminishing return to capital investment is formulated such that the second derivative of G with respect to capital is negative. This is the most straightforward way to capture the feature of diminishing return. However, confirming the diminishing return property by testing the shape of the second-order derivative of the aggregate production function is hard to implement for two reasons. First, to have a valid test for the shape of the production function, the functional form of the production function should not be restricted, or at least a class of flexible functional forms that allow either absence or presence of diminishing return should be specified. This would be difficult and inevitably involve further ad hoc assumptions in specifying such class of flexible functional forms. Second, the relationship between aggregate output and aggregate inputs is supposed to be endogenous. For example, the observed output can change in response to the changes in productivity level, but so does the capital stock. Testing the endogenous response of output against the endogenous capital stock particularly in terms of nonlinear curvature is not likely to deliver a reliable and robust result for the presence of the diminishing return property.
However, recalling Solow’s original argument in stabilizing the Harrod-Domar system, the content of the diminishing return in fact can be equally captured by the negative relationship between investment rate and output-capital ratio as in equation (7), which is much more straightforward to test. We utilize this relationship to test the presence of the diminishing return.
We use the recent cross-country panel data of the Penn World Table version 8.0 (PWT 8.0 for short), where the quality of measurement of aggregate variables are substantially improved over the past versions.1 For the details of the measurement of the Penn World Table version 8.0, see Feenstra, Inklaar and Timmer (2013). The most important improvement in the PWT 8.0 is about the measurement of the capital stock. Unlike the previous method of the past Penn World Table versions, PWT 8.0 differentiates the capital assets into the six sub-categories of structures, transport equipment, ICT assets (computers, communication equipment, and software), and other machinery and assets, and applies different depreciation rates as well as different price deflators to each category of assets in calculating the aggregate capital stock. Also in imputing the initial capital stock, rather than applying the steady-state assumption as in the previous versions of the PWT data, PWT 8.0 allows that the observed capital stock data represent the capital stock values in transition dynamics, which is more realistic not only for the developing countries but also for most of the developed countries. Thus, the use of the capital stock data in the PWT 8.0 fits well the purpose of this paper which requires precise measurement of output-capital ratio during transition.
2. Test Results
The output-capital ratio ν is measured by the ratio of "cgdpe" (expenditure-side of real GDP at current PPPs in million 2005 U.S. $) to "ck" (real capital stock at current PPPs in million 2005 U.S. $) in the PWT 8.0. The investment rate λ is measured by the "csh_i" (share of gross capital formation at current PPPs) in the PWT 8.0. The scatter diagram for the output-capital ratio and the investment rate in logarithm scales for the available sample of 144 countries for the period of 1950~2011 is given in Figure 1, which shows the unconditional elasticity of output-capital ratio with respect to the investment rate is significantly negative at −0.571.
Figures 2.1 to 2.6 plot this relationship by six differentiated regions of "Europe & Offshoots," "Latin America & Caribbean," "East Asia," "Southeast Asia," "Middle East & North Africa," and "Sub-Saharan Africa."2 They deliver two interesting findings. First, the investment elasticity of output-capital ratio of each region is significantly negative, hence the presence of diminishing return, for each and every region. Second, however, there are substantial differences in the magnitudes of the elasticities across regions showing patterns. The degrees of diminishing return, measured by the absolute magnitude of the negative elasticity, are lower in Europe & Offshoots region (with elasticity of −0.381) and East Asian region (with elasticity of −0.409) than those in Latin America & Caribbean region (with elasticity of −0.668), Southeast Asia (with elasticity of −0.507), Middle East & North Africa (with elasticity of −0.636), and Sub-Saharan Africa (with elasticity of −0.545) regions. That is, the diminishing return seems to be stronger in regions where the income growth is low, and most of the countries in those regions are poor. This implies that the growth effects of the investment promotion are likely to be expired faster in these already-low-growth regions.
These regional differences in the investment rate elasticity of output-capital ratio may be due to the differences in technological changes across regions. For example, high level of productivity may raise the marginal product of capital for a given level of capital, hence compensate the decrease in output-capital ratio from the force of diminishing return. The presence of country-specific fixed effects can be another reason for these differences. These possibilities are brought to the data and we attempt to estimate the elasticity controlling for the measured TFP and time trend as well as the country-specific fixed effects.
Table 1 reports the estimates of the investment rate elasticity of output-capital ratio in various specifications. The dependent variable is the output-capital ratio, and independent variables include a variety of combination of the dummy variables for the six regions (with Europe & Offshoots as the reference category) interacted with the investment rate, TFP, and the time trend. The TFP variable is measured by the "ctfp" in the PWT 8.0 data. We limit our sample to the countries where the TFP data are reported for the purpose of consistent comparison across specifications. Our chosen sample consists of 97 countries for the period of 1950~2011 in an unbalanced panel. All variables are continuous and measured in logarithm, hence the estimated coefficients represent the elasticities. The standard errors of the estimates are reported in parentheses below each estimate. The coefficient of the X_dk (for k = 2, ··· , 6) indicates the additional magnitude of the elasticity of the output-capital ratio with respect to variable X in region k compared to that of the Europe & Offshoots region (the coefficient of the X variable). The region index is 1 for Europe & Offshoots, 2 for Latin America & Caribbean, 3 for East Asia, 4 for Southeast Asia, 5 for Middle East & North Africa, and 6 for Sub-Saharan Africa.
The specification M1 is the that of simple pooled OLS without controlling any terms. The simple OLS estimation results show that the magnitudes of the investment rate elasticity of the output-capital ratio are larger, hence the degree of diminishing return is stronger in most non-European regions than in Europe & Offshoots region. This seems particularly so in Latin America & Caribbean and Middle East & North Africa regions. The implied elasticities from the OLS estimates are −0.648 (= −0.344 −0.304) for the Latin America & Caribbean region, and −0.673 (= −0.344 −0.329) for the Middle East & North Africa, while that for Europe & Offshoots region is −0.344. Controlling for the country-specific fixed effects, the panel estimates of the investment rate elasticity of the output-capital ratio are smaller than the OLS estimates, but are still significantly negative and substantial.
The specification M2 controls the country-specific fixed effects by the random effect GLS model.3 After controlling for the fixed effects, the magnitude of the diminishing return gets smaller than the OLS estimates. The elasticity of the Europe & Offshoots region becomes −0.174, and again the elasticities of other regions, particularly the Middle East & North Africa and the Sub-Saharan African regions, are larger than that.
The M3 specification estimate the random effect model without regional interaction terms but controlling for the measured TFP. Here, we find that the TFP elasticity of the output-capital ratio is significantly positive and substantially large at 0.585. Controlling for this TFP effect, the magnitude of the investment rate elasticity of the output-capital ratio becomes larger at −0.263. This illustrates that the TFP-induced output growth exceeds the associated capital growth, while the investment-driven output growth is smaller than the capital growth from the investment. The M4 specification adds the liner time trend term to control for the potential autonomous trend of the output-capital ratio that are independent from the changes in investment rate and the measured TFP. The estimate of the coefficient of the time trend term turns out to be significantly negative at −0.0085, and incorporating this effect, the magnitudes of the elasticities become smaller but only slightly for both the investment rate and the TFP.
The M5 specification, which is our benchmark, incorporates the region-specific TFP and region-specific time trend effects. The M5 column of Table 1 reports only the regional interaction terms of investment rate and TFP, not the time trend interaction terms, the coefficients of which are very small. It turns out that the TFP elasticities of output-capital ratio are significantly different across regions. The TFP elasticity of the Europe & Offshoots region is very large at 0.604. The TFP elasticities are significantly smaller in Latin America & Caribbean region (by −0.140), East Asia (by −0.397), and Middle East & North Africa (by −0.098) than in the Europe & Offshoots region, while it is significantly higher in Sub-Saharan Africa (by 0.145). Surprisingly, controlling for these region-specific TFP effects (as well as the region-specific time trend effects), the regional differences in the investment rate elasticity of output-capital ratio all become insignificant. Thus, we may infer that the observed (unconditional) regional differences in the degree of diminishing return seem to be due to the differences in the region-specific responses of output-capital ratio with respect to the productivity changes (which are captured by the measured the TFP and the time trend).
<Table 1>
Estimation of Investment Rate Elasticity of Output-Capital Ratio
Note : Estimates of the constant terms are not reported in all five specifications. In M1 specification, region dummies are included but we omit to report them. In M5 specification, we omit to report the region interaction terms with time trend. The asterisk represents the significance level, * for 10%, ** for 5%, *** for 1%.
Ⅳ. Implications on the Effective Development Policy
1. Generalized Growth Accounting Formula
The most fundamental question of the economic growth theory is what determines the sustainable growth of standard of living of the economy, typically measured by the income per capita. In other words, exploring the determinants of the steady-state growth rate of income per capita is the key question, although the transition dynamics of reaching the steady state is also an important aspect of the growth theory. A canonical form of the aggregate production function is specified such that
where A denotes the labor-augmenting technology index capturing the technological
changes, h is a human capital per worker, L is the number workers (or hours of work), and F satisfies the properties of (i) constant returns to scale (CRS) and (ii) the diminishing
return to capital investment, i.e., FKK =  < 0.
< 0.
Here, we derive a growth accounting formula in terms of the output-capital ratio without imposing any functional form restrictions on the aggregate production function F other than the CRS and diminishing return properties. The CRS property implies that output-capital ratio ν is given by

hence

Denote the output per worker and capital per worker by  and
and  . Then, again using the CRS property together with the capital equation (8), the output
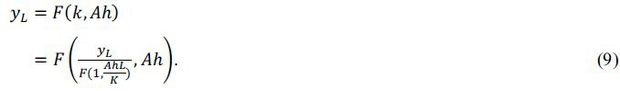
per worker is expressed as
. Then, again using the CRS property together with the capital equation (8), the output
per worker is expressed as
Differentiating both sides of equation (9) with respect to time (denoting the time derivative of variable x by ẋ), we have

Dividing both sides by yL, we have
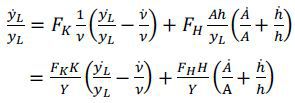
i.e.,
where gx denotes the growth rate of the corresponding variable x,  is the capital elasticity of output, and
  is the human-capital embodied labor elasticity of output. Note that ϵK + ϵH =1 because of the CRS property. Thus, we have the growth accounting formula such
that
is the human-capital embodied labor elasticity of output. Note that ϵK + ϵH =1 because of the CRS property. Thus, we have the growth accounting formula such
that

2. Implications on the Effective Development Policy
The diminishing return to capital investment implies that the output-capital ratio monotonically decreases during transition and becomes constant in steady state, i.e.,
 = 0.
= 0.
and the steady-state growth rate of output per worker is
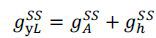 .
.
To get the growth rate of the income per capita, defined as y ≡ Y/N, it is enough to add another term of the growth of employment rate of population (l ≡ L/N) such that

However, the steady-state growth rate of income per capita is still the same as that of per worker term, i.e.,

because the employment rate l has an upper bound of unity and cannot grow forever. Note that the steady-state growth rate of output per worker does not depend on capital accumulation unlike the Harrod-Domar model. The steady-state growth accounting equation (12) shows that the only potential sources of sustainable growth are to be related either with productivity growth or with human capital growth.4
The implication of the above neoclassical growth theory on the development policies is rather simple but strong. First, it is worth noticing that many national development policies or foreign aid programs have been emphasizing the importance of expanding investment opportunities or building equipment and infrastructure either by mobilizing the domestic resources or relying on the foreign resources such as foreign direct investment (FDI) or official development assistance (ODA). These development policies of investment promotion are of course important, because that is the channel through which the actual growth is realized, and can help reducing the national poverty. Without such capital formation, all kinds of growth may not be materialized, and hence promoting the investment is critical.
However, the above steady-state growth accounting results suggest that any growth mechanism solely based on physical capital accumulation would deliver only temporary growth and such growth is supposed to stop eventually. The only possible sources of the perpetual growth would be either productivity or human capital growth as are addressed by Lucas (1988) and Romer (1990). Furthermore, even during transition when capital accumulation contributes to income growth, productivity and human capital play an important role. That is, productivity and human capital growth mitigates the force of diminishing return to capital investment, hence the income growth from capital accumulation can last longer when the productivity and human capital grows along with the capital investment. The latter role of productivity and human capital is less appreciated in the literature.
Our test results show that the idea of diminishing return is indeed born out by the data. Thus, the above implications on sustainable growth are not just theoretical possibilities, but are actually validated from the data. Furthermore, our empirical analysis above provides strong confirms that the declining output growth relative to capital growth due to the force of the diminishing return can be weakened by the productivity growth. This suggests that any development policy aiming to promote investment opportunities can be successful and sustained, only if the productivity growth accompanies the capital investment. Otherwise, simple injection of capital may jump-start the economic growth, but such growth would end soon.
Ⅴ. Conclusion
This paper examined the implications of capital investment on the sustainable growth and on the effective development policies from the perspective of neoclassical growth theory. Though taking variety of forms, the essence of the neoclassical growth theory lies in the growth process from capital investment. Solow first provided a fundamental insight to this mechanism, fixing the so-called knife-edge problem of Harrod-Domar model. The key device was the classic concept of diminishing return, which was originally proposed by David Ricardo. We proposed a way of testing the diminishing return and confirmed its strong presence using the recent PWT 8.0 data. The presence of the diminishing return validates Solow’s implications on long-run growth as well as on the transitional growth based on capital investment, illustrating the importance of productivity growth. These results do not deny the importance of capital accumulation in the process of growth and development. As was repeatedly emphasized, capital accumulation is the fundamental component of the growth process because the actual growth is materialized through the capital accumulation. The main message from Solow as well as from the empirical evidence we provide in this paper is that such capital-driven growth mechanism is supposed to stop working unless there accompanies the productivity growth. For example, investment projects such as building schools or hospitals with teachers or doctors and nurses who are not equipped with appropriate knowledge and technology would not deliver any effective development. This may sound too obvious. Unfortunately, however, this is how most development policies, utilizing either ODA or FDI, have been designed and implemented in many developing countries. The simple lesson for the development policy makers to learn from this paper is that the force of diminishing return is real, and they are advised to remember this fact in designing and implementing the development policies to make such policies sustainable and effective.
Notes
We estimated the within-group fixed effect model also. The results are similar between the within-group fixed effect model and random effect model. The Hausman test (with the x2 test statistic value of 69.93) supports the random effect model over the within-group fixed effect, hence we focus on the random effect model specification.
These two sources are still potential ones. Depending on assumptions on the dynamic process of A and h, the growth from these sources may disappear in steady state as well. However, at least, diminishing returns to capital accumulation itself does not dismiss these sources of growth in the long run.
References
(1946). Capital Expansion, Rate of Growth and Employment. Econometrica, 14, 137-147, https://doi.org/10.2307/1905364.
(1957). A Model of Economic Growth. Economic Journal, 67, 591-624, https://doi.org/10.2307/2227704.
(1990). Endogenous Technological Change. Journal of Political Economy, 98(5), S71-S102, https://doi.org/10.1086/261725.
(1956). A Contribution to the Theory of Economic Growth. Quarterly Journal of Economics, 70, 65-94, https://doi.org/10.2307/1884513.
(1957). Technical Change and the Aggregate Production Function. Review of Economics and Statistics, 39, 312-320, https://doi.org/10.2307/1926047.