- P-ISSN 2586-2995
- E-ISSN 2586-4130

Whereas a large variety of previous studies show mixed results regarding the relationship between public investment and economic outcome, several studies have been conducted on related issues in Korea. The present study deals with the effect of public investment in Korea on economic growth and productivity. Using administrative data, it exploits three different methodologies: the total factor productivity approach, production function approach, and stochastic frontier production function approach. The results of this study show that public investment has a statistically significant effect on economic growth. However, it contributes little to enhance productivity. It is explained that there exists inefficiency of production in the Korean economy. These findings indicate that public investment has played a central role in the direct input factor and not in indirect role in Korea. Thus, it is necessary for public investment policies to concentrate on enhancing the efficiency of the Korean economy.
Public Investment, Public Capital, Total Factor Productivity, Production Function, Stochastic Frontier Production Function
C13, D24, H41
Since the 1970s, the Korean government has steadily made much effort to enhance the economy. Above all, the effort to expand public investment has been recognized as one of the key factors that led to the remarkable economic growth which occurred in Korea. The annual growth rate of fixed assets consequently exceeded 10% until the 1997 Asian financial crisis and afterwards recorded 5%. This leads to the questions of how much public investment affected economic growth and productivity in the Korean economy and whether these effects of public investment differ over time or by sector?
There has been long-standing debate over the role of public investment. It is commonly known that public investment promotes national economic growth, improves productivity, and contributes to the long-term development of nations as a productive factor in an economy. A large variety of previous studies, however, show mixed results regarding the relationship between public investment and economic outcome. These studies begin with questions about how much public investment contributes to economic growth, productivity and production cost reductions and investigate the differences in the productivity of public investment by sector, region or country (Aschauer, 1989; Hulten and Schwab, 1991; Holtz-Eakin, 1994; Evans and Karras, 1994; Bonaglia et al., 2001; A. Warner, 2014a). The underlying questions in these studies refer to the role of public investment and to the path by which it influences economic growth and improves productivity.
The role of public investment is in general twofold. As a direct element of production such as labor and capital, it can increase economic output. It can also play an indirect (or intermediate good) role to reduce inefficiency and transaction costs during the production process, with externalities (Kim and Kim, 2008; Lee, 2008). In other words, through different attributes of public investment, economic growth can be achieved by increasing input factors such as capital and labor as used for production or by improving efficiency overall. Thus, when analyzing the relationship between public investment and economic growth, it is crucial to separate the role of public investment.
For this reason, a large number of previous studies attempt to isolate the direct and indirect impacts of public investment. To observe the direct impact, output elasticity or marginal productivity is normally estimated with data on the real GDP of the country in question, or the output of private firms is assessed through a production function approach. Kim and Song (2013) analyze the marginal productivity of SOC capital stock by sector, including roads, railways, electricity and communication, and water supply and sewerage with administrative data from 1970 to 2014. The marginal productivity of each sector showed a decrease from 0.93 to 0.32 for private capital, from 0.8 to 0.15 for roads, from 1.5 to 0.5 for railways, from 0.8 to 0.26 for electricity and communication, and from 1.9 to 0.47 for the water supply and sewerage category. This implies that investment in the road sector is oversupplied while that in the water supply and sewerage sector is lacking. Shioji (2001) uses the convergence approach to analyze the effect of economic growth on the types of public capital in the US and Japan, reporting that the output elasticity of public capital ranged from 0.1 to 0.15.
On the other hand, the indirect impact of public investment can be estimated through a total factor productivity approach. Hulten and Schwab (1991) argue that the relationship between the growth rate of total factor productivity and public capital is limited. Aschauer (1989) reports that the output elasticity of public capital is 0.35, implying that public capital is closely related to productivity. On the other hand, Holtz-Eakin (1994) studies the influence of the accumulation of public capital on private firm productivity for 48 states in the United States. They report that it has a negative impact on private firm productivity, which means that there is little benefit related to productivity beyond direct supply (Evans and Karras, 1994). Bonaglia et al. (2001) analyze the effect of public infrastructure investment on total factor productivity, productivity and cost reductions using regional data from Italy from 1970 to 1994. It was reported that the effect of public investment varies by region. Overall, investment in public transportation, especially railways in the northern area and roads in the central-south region, largely contributes to an improvement in productivity. In Korea, Choi et al. (2012) analyze the productivity of public capital and the efficiency of spatial allocation by comparing the situation before and after decentralization. They report that the efficiency of spatial allocation worsens because public capital is oversupplied as compared with private capital after decentralization. It is interpreted that resource allocation is shifted from efficiency to equity. Lee (2008) emphasizes the classification of the effect by the production input factor and productivity in analyzing productivity. He claims that the most effective element to improve total factor productivity is to increase the economy of scale of firms.
As mentioned above, the results differ, with different findings showing a positive or negative relationship between public investment, productivity and economic growth. The main causes of these mixed results are discussed below. First, obtaining reliable data of public capital stock is limited. Second, the characteristics of the regions or countries in question are heterogeneous. Third, there are econometric issues, such as an endogeneity problem. It is thus an interesting challenge to take into account these issues when analyzing the effect of public investment.
In the past, it was generally true that the Korean government made great efforts to expand public investment to improve the efficiency of resource allocation. However, some doubts about the effectiveness of this strategy have been raised. The growth rate of total factor productivity in the manufacturing sector has continuously decreased since the 2000s (Korea Productivity Headquarters, 2013). Moreover, it was reported that the marginal productivity of SOC capital stock fell by more than 60% in 2013 compared to that in 1970 (Kim and Song, 2013). However, such phenomena are not limited to Korea. Productivity in most Asian countries is decreasing. It is often interpreted that the main cause of economic growth in Asian countries is not due to improvements in productivity but to increases in production input factors. Krugman (1994) warns that low productivity functions as a threat to economic growth in the future.
Although the ongoing debate about the role of public investment has not yet drawn concrete conclusions, it nonetheless concentrates on how to improve the economic growth and productivity of the country through public investment in the long run. It is clearly a question that should be asked regarding the Korean economy. Thus, at this point in time, it is judged that presenting a clear answer to this is important.
In this study, I examine how much public investment contributes to productivity improvements and to economic growth in the Korean economy. To investigate these effects, I use unique administrative data thus far unused in previous work, except for one study, and discuss econometric issues to overcome the problems which arose in previous studies. This may secure the reliability of the results. The main contribution of this research is that it considers various forms of public investment, such as R&D and human capital stock as well as SOC stock. Previous studies in general focus on only SOC stock in their analysis of the effect of public investment. This approach only provides implications regarding how SOC capital stock affects economic outcomes. It will make it difficult to derive implications pertaining to the effect of public investment only with specific stocks. When we interpret public investment in a broad sense, public capital encompasses transportation assets, equipment assets, R&D assets and human assets as well. Thus, this study examines the effect of public investment overall by sector to derive more general implications. Moreover, to ascertain the effects of public investment on economic growth and productivity, three different methodologies are used. Through these analyses, this study attempts to find evidence that public investment improves productivity. If not, these causes are investigated. Finally, the study suggests implications regarding future direction of public investment for productivity improvements.
The remainder of the paper is as follows. Section II explains the conceptual framework of the role of public investment. Section III introduces data and methodology utilized for empirical analysis. Section IV presents the analysis results, and finally in Section V, it provides conclusions and future direction of public investment in Korea.
In this study, public investment is defined as investment in public infrastructure, transportation facilities, machinery facilities, R&D and education. Each capital stock is utilized in the empirical analysis. The aim of this chapter is to see how each public investment affects economic growth and productivity. This can be explained as the role of public investment.
In general, the role of public investment can be divided into direct and indirect influences. A direct impact means that public investment acts as a direct component of production, such as labor or capital, and that it has a direct effect on production. The indirect impact is that it increases productivity by reducing inefficiency or by lowering transaction costs during the production process with externalities. This type can be explained by a general production function. Based on the Cobb-Douglas production function, the growth rate of TFP is derived (Hulten and Schwab, 1991).
Here, Ȧ is the TFP growth rate; Q is the output of the economy, which is the real GDP; L and K are labor input and private capital stock;  ,
,  , and
, and  are the growth rate of each variable, respectively; and α1 and β1 correspondingly denote the labor and capital share. Although an economy in a country
is also affected by public investment, in equation (1), public investment by the government
is excluded. It is impossible to examine the role of public investment. Thus, it is
necessary to transform the production function on the assumption that public investment
directly or indirectly affects economic growth (Q = A(KG)F (L,K,KG)). Here, KG is public investment and KG under A implies the indirect effect. KG under the function F is the direct effect as a production factor. Moreover, A, implying technological progress or productivity improvements, can be classified
into two categories: true technology progress A and productivity improvements due to public investment. Equation (1) is then transformed
into equation (2), as follows,
are the growth rate of each variable, respectively; and α1 and β1 correspondingly denote the labor and capital share. Although an economy in a country
is also affected by public investment, in equation (1), public investment by the government
is excluded. It is impossible to examine the role of public investment. Thus, it is
necessary to transform the production function on the assumption that public investment
directly or indirectly affects economic growth (Q = A(KG)F (L,K,KG)). Here, KG is public investment and KG under A implies the indirect effect. KG under the function F is the direct effect as a production factor. Moreover, A, implying technological progress or productivity improvements, can be classified
into two categories: true technology progress A and productivity improvements due to public investment. Equation (1) is then transformed
into equation (2), as follows,
where α2 and β2 are the elasticity of output, δ is the elasticity of public investment on technological progress, and γ denotes the elasticity of public investment to technological progress. If equation (2) is subtracted from equation (1), equation (3) can be derived using the following equation (Ferrara and Marcellino, 2000).
In other words, this implies that the improvement in productivity can be explained by the growth rate of labor input, private capital stock, public capital stock and true technological progress, meaning that it is possible to distinguish productivity improvement from that by true technological progress or by an increase in capital stock. In this study, I examine the effect of the growth rate of public investment on productivity improvement based on equation (3). Productivity improvement by sector is also examined in order to determine the sectoral effect. However, in the sectoral analysis, the heterogeneity of the type of public investment may have different effects on economic growth or productivity in a different manner. Therefore, it is necessary to consider the characteristics of capital stock by sector in the analysis. For example, in the case of R&D, productivity can be influenced by direct innovations and by ripple effects through technology transfers. Likewise, education can impact productivity depending on the level of human capital, which leads to differences in economy growth. That is, it is necessary to identify the paths by which the effects work on productivity or economic growth by sector and to analyze them according to their characteristics. In order to do this, using a structural model is more appropriate. However, the structural interactions between related variables have not yet been studied in depth. Theoretically, it was reported that they are unclear (Lee, 2008). This is a limitation of this study, and additional research is needed in this area.
For this reason, in previous research, the differences between the paths were adjusted to differences in time, which generally affects the analysis. For example, Kwack and Lee (2006) conduct an analysis based on the same point in time to examine the relationship between educational spending, R&D expenditures and economic growth. Griffith et al. (2004) use the first-difference estimator to ascertain the effect of R&D investment on productivity. In other words, rather than classifying the paths of the effects by the types of public investment, as in various studies, these studies used the difference in the time lag to determine economic growth. The present study follows this approach.
The conventional methodology to analyze the relationship between public investment and productivity is growth accounting. A production function approach is used to estimate output elasticity. To this end, labor and capital inputs are used as input factors, with real GDP used as an output factor. Relatively, labor input and GDP data can easily be obtained, but as pointed out in previous studies, researchers have had difficulties in obtaining reliable capital stock data in many countries.
In Korea, capital stock data were not properly constructed until 2013. Accordingly, it was difficult for individual researchers to utilize published capital stock data. However, since 2014, the Bank of Korea has been compiling five sets of statistical data: national income statistics, interindustry relationship tables, money flow tables, balance of payments statements, and national balance sheets. In the national balance sheets, a stock account that records the capital status at a certain point is presented, allowing more reliable data to be utilized. The capital stock data of the national balance sheet is utilized in this study.
The national balance sheet is divided into non-financial assets and financial assets/liabilities. The non-financial assets are divided into production assets and non-production assets. Production assets are divided into fixed assets and inventory assets, and fixed assets are divided into construction assets, equipment assets, and intellectual property assets. As described above, in this study, it is important to grasp the relationship between public investment and productivity; hence, a definition of public investment and the division of available capital stock should be done beforehand. I define public investment as investment related to governmental gross fixed capital formation, and available capital stock includes only durable and reproducible assets in the economy. In other words, according to these criteria, the assets available for this analysis can be regarded as a group consisting of nonfinancial assets, production assets, fixed assets, and construction assets; equipment assets; and intellectual property products assets. In detail, how public capital stock is divided is shown in Table 1.
Note: Roads, airports, railways, subways, and ports are classified as transportation facilities, and river and water sewage are classified as water resources. Other assets include agriculture and forestry, urban civil engineering, and other civil engineering assets.
Specifically, capital stock is divided into public infrastructure, transportation facilities, machinery equipment, and R&D. Public infrastructure is divided into non-residential buildings, transportation, water, electricity and communication, and other assets. In addition, transportation facilities, machinery and R&D assets are classified into private capital and public capital, and public infrastructure assets are considered only to be public capital. However, ICT assets among machinery assets are included as R&D assets in the empirical analysis and private capital is used as the sum of transportation facilities, machinery facilities and R&D assets.
Next, quarterly data from 1970 to 2015 are used in the empirical analysis, and Table 2 shows the summary statistics of the data used.1 In Table 2, the average growth rate for public infrastructure among public capital stock (log level) is 0.18 to 0.25%, and that of the transportation facilities is 0.23%. The growth rate of ICT assets is higher than that of non-ICT assets. That of R&D assets is 0.32%, which is higher than those of the other assets in the public sector. For private capital, transportation facility assets, ICT assets, non-ICT assets, and R&D assets grow by 0.2%, 0.55%, 0.23% and 0.37%, respectively. The data of the real GDP and labor force population used here are from the National Statistical Office. The real GDP growth rate is 0.16%, and the growth rate of the labor force population is 0.06%.
In the last row in Table 2, the human capital index is presented. This index is used because educational investments form a major part of public investment, and the difference in human capital formed by the education investment affects economic growth and productivity. However, because information on human capital is not presented in the data from the Bank of Korea, I use the Penn World Table (PWT), which provides national account data for each country since 1950. PWT data provides country-specific economic statistics for research purposes at UC Davis in the United States.
The human capital index covered in this study is based on the average years of education and the educational performance of individuals over 25 years old. It is constructed according to the methodologies of Barro and Lee (1993) and Caselli (2005). In previous studies utilizing the human capital index, Barro and Lee (1993) use the average years of education, and Tallman and Wang (1994) divide the population according to the education level. Mulligan and Sala-i-Martin (1995) use labor income, and Kim (1997) and Shim (2000) use the educational expenditure index. However, as in these studies, the use of the human capital index can be problematic if only a single index is used. As mentioned above, because PWT uses two variables to construct a human capital index, it is more suitable for this study. It provides human capital indexes for individual countries on a scale of 0~4, and the average of only human capital index in 144 countries is 2.1783. The average of only human capital index in Korea is 2.855, which is 30th among 144 countries.
This chapter focuses on whether public investment contributes to productivity improvements and economic growth, and it expands the discussion on whether there is production inefficiency in the Korean economy. To do this, I investigate the effect of productivity improvements by resetting the empirical models based on equation (3). I examine the effects on economic growth and productivity through the production function and analyze the inefficiency of production through a stochastic frontier function. Moreover, the effect of public capital stock is investigated according to sector and time period.
Total Factor Productivity Approach
Unlike the single-factor productivity estimation method, total factor productivity (hereinafter referred to as productivity) is used to measure the overall efficiency of production considering input factors overall. Technological advances that are not included in the single-factor productivity estimation approach are included. Total factor productivity analysis derived from residuals has an advantage in that it can measure the overall efficiency of the production function transfer and production process and deal with production costs, technological advances and equipment improvements.
As shown in equation (3), the growth rate of productivity can be explained by the growth rates of labor input, private capital stock, and public capital stock. In the empirical analysis, I examine how the growth rates of these variables can explain productivity improvements. Moreover, sectoral impacts are investigated by dividing the public capital stock into the sector. First, I derive TFP through the Cobb-Douglas production function (Y = AF (L,K)), which is generally used to derive the growth rate of productivity.
In this equation, lower case refers to the log level, a represents productivity, y is the real GDP, and l and k are the total labor supply and capital stock, respectively.  and
and  are estimates of the elasticity of labor and capital.
Next, based on the estimated productivity, I examine how the growth rate of productivity can be explained by the growth rate of public capital stock. In order to enable an empirical analysis, I modify equation (3) by identifying factors that may cause productivity changes. Factors that may affect productivity growth are the productivity level and the capital stock level of the previous year. Thus, the model for the regression analysis considers the capital stock level and the growth rate simultaneously (Tatom, 1991). Moreover, the time trend variable is included as a control variable in the model. Finally, the equation for analyzing the effect of public capital stock on productivity improvements is as follows:
Here, Δat is the growth rate of productivity between the previous year and pertinent year, at-1 is the level of productivity of the previous year, kpubit-1 is the level of public capital stock of the previous year, the subscript i denotes public capital stock by sector (e.g., public infrastructure, R&D/IT, human capital), kprit-1 is the level of private capital stock, and l and t are correspondingly the labor force population and the time trend. Δ (= t – t –1) refers to the rate of change between the previous year and the pertinent year. One-year and two-year time differences are postulated in the regression analysis.
Production Function Approach
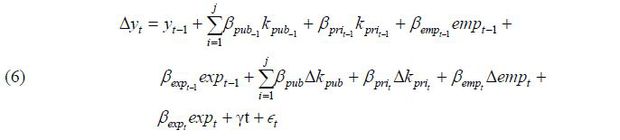
Next, I investigate the relationship between public investment and economic growth using the Cobb-Douglas production function via the same methodology used with the TFP approach. Similar to equation (5), the model includes the level and growth rate of capital stock. As control variables, the growth rate of labor force participation and the amounts of export variables are added because they can directly affect the real GDP. This implies that the higher the growth rate of labor force participation is in the economy, the greater the real GDP, and the more exports increase, the greater the real GDP becomes.
Here, Δyt (= yt – yt-1) is the growth rate of the real GDP per capita between the previous year and the pertinent year, yt-1 is the level of real GDP per capita in the previous year, kpubit-1 is the level of public capital stock in the previous year, the subscript i is the public capital stock by sector (e.g., public infrastructure, R&D/IT, human capital), kprit-1 is the level of the private capital stock, and emp and t are correspondingly the growth rate of labor force participation and the time trend. exp denotes the export amount. Δ(= t – t – 1 ) means the rate of change between the previous year and the pertinent year. One-year and two-year time differences are postulated in the regression analysis.
Stochastic Frontier Function Approach
The two preceding methods can provide answers as to whether public capital causes productivity improvements and affects economic growth. However, it is difficult to determine whether or not the production process of the entire economy is efficient. In order to determine whether there is inefficiency in production in the entire Korean economy, I use the stochastic frontier function. The stochastic frontier function approach consists of the step of estimating the parameters and the step of measuring the efficiency of production using parameters and residuals. The model for this is as follows (Aigner, Lovell, and Schmidt, 1977):
Here, yi is the output variable, xi is the production input factor, exp(vi) is a random error, the exogenous effect on the individual production unit, and exp(–ui)(ui ≥ 0) implies the level of technical inefficiency. In equation (7), the remaining part (except for exp(–ui) ) indicates the stochastic production frontier, and the technical efficiency of individual production unit is expressed by equation (8).
Because it is impossible directly to estimate ui ,  is generally derived via a Cobb-Douglas production function.
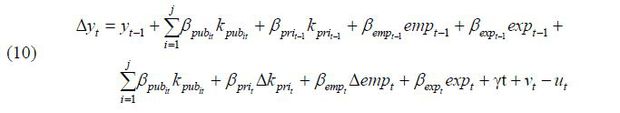
Next, given that inefficiency implies a negative (-) factor, it is necessary to assume the distribution of ui . In general, to make ui positive, normal-half normal, normal-exponential, normal-truncated normal and normal-gamma distributions are assumed. In this study, the normal-half normal distribution, often used, is assumed. I modify the previous equation (6) to determine whether technological efficiency exists when considering public capital stock.
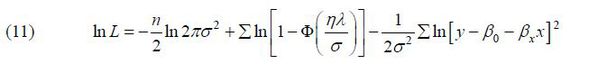
Here, all of variables in equation (10) are identical to those in equation (6) except for the error terms assuming a normal distribution and indicating technical inefficiency in production. The overall error term is εt (= vt – ut ), and vt and ut are assumed to be independent. Equation (10) can be estimated by the maximum likelihood method (MLE),
Where η = v – u, λ = σu / σv is the ratio of the standard error of technical inefficiency to the standard error, and the determination of technical inefficiency depends on the statistical significance of λ. In other words, if λ = 0, technological inefficiency does not exist, and if λ is statistically significant, technical inefficiency exists.
Total Factor Productivity Approach
The growth rate of TFP as derived through residuals can be estimated from equation (4). Based on this, the trend of the growth rate of productivity (log level) from 1970 to 2015 is shown in Figure 1. As shown in Figure 1, the rate of change in productivity has continued to increase and decrease, but in particular, the growth rate of productivity declined significantly in 1980 and 1998. This is the impact of the oil crisis in 1980 and the Asian financial crisis of late 1997. However, except for these crisis situations, the growth rate of productivity increases overall. This raises the question of how much public investment contributes to productivity change. To this end, I examine the effect of public capital stock and productivity on productivity improvement through equation (5).
Although this analysis uses quarterly data, the growth rate of all variables considered in the empirical analysis is calculated as the difference between the current year and the previous year (Δt = t0 – t-4) and the difference between the current year and the two prior years (Δt = t0 – t-8) Table 3 shows the effect of public capital stock on the productivity improvement, as calculated from the difference between the current year and the previous year.
Column (1) and (2) in Table 3 are the results obtained through the OLS (ordinary least squares) method. First, in column (1), there is a negative relationship between the level of productivity of the previous year, the level of private capital stock, and productivity improvement, but public capital stock and the human capital index are found to have a positive effect on productivity improvement. Moreover, the labor input variable shows no statistically significant effect on productivity improvement. Second, the growth rate of public capital stock is negatively correlated with the growth rate of human capital stock, while the growth rate of private capital stock is positive. In column (2), I use dummy variables3 to examine whether the effects of changes in public investment on productivity improvements differ by period. The coefficients of all variables are not significantly different from those in column (1), and the effect of public capital on productivity improvement decreases over time. However, it is often reported that auto-correlation problems arise in time-series data and that it is difficult to derive consistent estimates without solving this problem. To verify this, the Durbin-Watson test is used in general. The test results here show that the Durbin-Watson statistic values (d) are 0.653 and 0.8394, which indicates a serious autocorrelation problem in the model. Therefore, I use the Prais-Winsten method to solve this problem. This method is used to obtain an efficient estimator when covariance matrices are unknown when analyzing time-series data. Estimates can be obtained using the FGLS (Feasible GLS) method, similar to the Cochrane and Orcutt method, but the difference between them is that this approach does not exclude the first observation (t=1). As a result, the Prais-Winsten method can solve the autocorrelation problem and obtain an efficient estimator.
Note: Standard errors are in parenthesis and *, **, and *** indicate significance at the 10%, 5%, and 1% levels, respectively.
Columns (3) and (4) are the results of the analysis using the Prais-Winsten method, which showed that the d-values of the Durbin-Watson test are 1.961 and 1.957, indicating that the autocorrelation problem is significantly mitigated. This implies that the results can be trusted. In column (4), I examine the effect of public capital stock over time using dummy variables, as in column (2), and the coefficients of all variables in column (3) and column (4) are similar overall. Therefore, only the results of column (4) are mentioned here.
Interestingly, after solving the autocorrelation problem, the changes in public capital stock and the growth rate do not have a statistically significant impact on productivity growth. On the other hand, the effect of human capital stock becomes much greater, and the increase in labor input does not have a positive effect on productivity improvement. In addition, the statistical significance of the growth rate of public capital stock over time is not determined. Therefore, it is necessary to examine whether this outcome is due to the calculation of the growth rate. This occurs because, in general, it is suggested that public capital needs a certain period of time to affect productivity. Therefore, the growth rate of all variables is derived from the difference between the current year and the two previous years, and this analysis using equation (5) again is presented in Table 4.
The results in columns (1) and (2) in Table 4 are derived by the OLS method, as in Table 3, and those in columns (3) and (4) use the Prais-Winsten method. In the analysis of the rate of increase according to a two-year time lag, the results are found to be generally similar to those in Table 3. The effects of public capital stock and the growth rate on productivity improvement are not statistically significant, and the signs of private capital and the labor input variable are identical. The sign of the coefficient of the human capital stock is also the same, and statistical significance is thus secured. In conclusion, Table 3 and Table 4 reveal that the level of public capital stock and its growth rate do not have a statistically significant effect on the improvement of economic productivity in Korea.
Note: Standard errors are in parenthesis and *, **, and *** indicate significance at the 10%, 5%, and 1% levels, respectively.
Next, in order to examine this more specifically, the time period is divided into the periods from 1970 to 1984, from 1985 to 1999 and from 2000 to 2015. The Prais-Winsten method is also used to solve the autocorrelation problem, as in the previous analysis. The time lag of the growth rate is one year, and these results are shown in Table 5.
Column (1) in Table 5 shows the results of the analysis of the entire period and is identical to column (3) in Table 3. Columns (2), (3) and (4) are the results of the analysis from 1970 to 1984, from 1985 to 1999, and from 2000 to 2015, respectively. These results show that public capital stock does not have a positive effect on productivity improvement over the entire period, while human capital stock has a positive effect on productivity improvement over the entire period. This is consistent with previous findings which showed that the growth rate of public capital stock does not have a positive effect on productivity growth through a period analysis. However, if I investigate the sectoral effect of public capital stock on productivity improvement, the effect varies depending on the type of public capital stock. Public infrastructure, which accounts for most public investment, and R&D and IT stock, which have recently become more important, are analyzed to determine the effect of each type of public capital on productivity. Similar to the previous analysis, the Prais-Winsten method is used to ascertain the sectoral effect by period. Column (1) in Table 6 shows the results of the analysis of the entire period and columns (2), (3) and (4) are the results of the analysis from 1970 to 1984, from 1985 to 1999, and from 2000 to 2015, respectively. These results are shown in Table 6.
Note: Standard errors are in parenthesis and *, **, and *** indicate significance at the 10%, 5%, and 1% levels, respectively.
Note: Standard errors are in parenthesis and *, **, and *** indicate significance at the 10%, 5%, and 1% levels, respectively.
The growth rate of public infrastructure capital such as roads, railways, ports, water resources, and electricity and communication has a positive effect on productivity improvement. On the other hand, the growth rate of R&D and IT capital stock does not show a corresponding statistically significant positive effect. The growth rate of human capital stock is positive but not statistically significant. However, if I divide it by period, more interesting results are obtained. Although the positive effect of public infrastructure capital was not derived by period, the growth rate of R&D and IT capital stock has been positively influenced productivity growth since 1985.
In conclusion, the effect of public capital stock on the productivity improvement is limited in the Korean economy, but there is a difference in the effect on productivity by sector. In particular, the findings that R&D and IT capital stock have positively affected productivity improvement since the 1990s and that human capital has a positive effect on productivity improvement imply that in the future these will be the most important factors when setting the directions for public investment.
Production Function Approach
Next, I use equation (6) to examine the effect of public capital stock on economic growth in Korea. The analysis period, the growth rate and methodology are identical to those applied in the previous TFP approach. Prior to the analysis, this study utilizes quarterly data, implying that we should initially investigate the time-series characteristics of the variables included in the empirical analysis. The unit root test can be used to verify the stability of the variables. The Augmented Dickey-Fuller test (ADF test) is generally used for this purpose. Table 7 shows the tau statistics, which is the ADF test result for level and differential variables.
As shown in Table 7, while the hypothesis that the levels of the variables have the unit root cannot be rejected, the hypothesis that the first differential variables have the unit root is rejected at the 1% significance level. This implies that the I(1) process will be stabilized if the first-order differential variable is utilized, and it is appropriate to use the first-differential variables in the empirical analysis.
Note: *, **, and *** indicate significance at the 10%, 5%, and 1% levels, respectively.
Table 8 presents the results after analyzing the effect of public capital stock on economic growth using Equation (6). Columns (1) and (2) are the results of the OLS analysis. Given that the d-values from the Durbin-Watson test are very low, 0.653 and 0.755, and considering that a serious autocorrelation problem occurs in the model, the Prais-Winsten method is also applied to this analysis. The d-values of columns (3) and (4) are determined to be 2.011 and 2.003, respectively, indicating that the autocorrelation problem is significantly alleviated. As shown in column (3), the level of public capital stock and the growth rate of public capital stock have a positive impact on economic growth. In addition, the level of human capital stock and the growth rate of exports both have a positive impact on economic growth. Column (4) presents the results of the effect of public capital stock on economic growth over time. The coefficients in column (4) are nearly identical to those in column (3) and the growth rate of public capital stock is shown to decrease in the 2000s.
Similar to the previous analysis, these results can be argued considering that the effects of public capital on economic growth may occur at a certain time lag. Thus, in order to observe whether the results in Table 8 are due to the calculation of the growth rate, Table 9 applies a two-year time lag to the growth rate of the variables.
The d-values in columns (1) and (2) in Table 9 are 0.529 and 0.566, respectively, which indicate that there is an autocorrelation problem. To correct this, I use the Prais-Winsten method, and these results are shown in columns (3) and (4). They are not significantly different from the results in Table 8. Although the statistical significance between the growth rate of public capital stock and economic growth has disappeared, the level of public capital stock has a positive effect on economic growth while the level of human capital is also found to be positively correlated with economic growth. Moreover, the statistical significance of the effect of public capital stock on the growth rate over time is shown to differ from that in Table 8.
Note: Standard errors are in parenthesis and *, **, and *** indicate significance at the 10%, 5%, and 1% levels, respectively.
However, it was also reported that in addition to the problem caused by the difference in the time lag, an endogeneity problem in the production function approach may occur. Holtz-Eakin (1994) adopted an IV method with using a second-difference variable to solve the endogeneity problem in production function equation with the first-difference variable. In this study as well, the model was estimated using lagged variables (Δt = t-4 –t-8) as instrumental variables for the growth rate variables (Δkpub , Δkpri , Δhc). As a result, the coefficients and signs of the variables are similar to those in Table 9 and the coefficient of the level of public capital stock is statistically significant, at 0.479 (0.092, standard error). However, there remains a possibility that the endogeneity problem may occur in addition to the growth rate of the variables. Therefore, it is unreasonable to conclude that the problem is completely solved by this method. Therefore, additional work is needed in the form of a more detailed study in the future.
Note: Standard errors are in parenthesis and *, **, and *** indicate significance at the 10%, 5%, and 1% levels, respectively.
Next, I examine whether the effects of public capital on economic growth differ by period. To do this, the entire period is divided into the sub-periods of 1970 to 1984, 1985 to 1999, and 2000 to 2015. As in the previous analysis, the Prais-Winsten method is used to solve the autocorrelation problem, and the time lag of the growth rate is one year. These results are shown in Table 10.
Column (1) in Table 10 shows the results of the analysis of the entire period, identical to column (3) in Table 8. Column (2) is the result of the analysis from 1970 to 1984, column (3) is from 1985 to 1999, and column (4) is from 2000 to 2015. According to the analysis by period, the effect of public capital stock does not appear to be positive. However, the level of human capital has been shown to have a positive impact on economic growth over the entire period.
Note: Standard errors are in parenthesis and *, **, and *** indicate significance at the 10%, 5%, and 1% levels, respectively.
Finally, I investigate the sectoral effect in more detail and determine its impact on economic growth by sector. A sectoral analysis is conducted in accordance with the criteria in the TFP analysis, again with the Prais-Winsten method used. These results are presented in Table 11. In Table 11, the levels of public infrastructure capital and its growth rate have positive effects on economic growth during the overall period. On the other hand, R&D and IT capital stock do not show statistically significant effects on economic growth. The coefficient of the human capital variable is shown to have a positive effect on economic growth. However, by analyzing this by period, while the level of public capital stock does not show a positive effect by period, the level of human capital is shown to have a positive effect for each period. For R&D and IT assets, although the growth rate does not have a positive effect in the entire period, a positive effect was found in the 2000s. This is similar to the results of the productivity analysis.
Note: Standard errors are in parenthesis and *, **, and *** indicate significance at the 10%, 5%, and 1% levels, respectively.
In conclusion, the results of the assessment of the effect of public capital on economic growth suggest that public capital stock has a positive effect on economic growth in Korea, but the effect of the period is limited. As a result of the sectoral analysis, the levels of public infrastructure stock and R&D and IT assets since 2000 have had positive impacts on economic growth. For human capital, it appears to have had a positive impact on economic growth in general despite the differences by period. It can be interpreted that the role of public investment as an input factor of production is high in the Korean economic system. However, in comparison with the results of the productivity analysis, public investment has not played an important role in increasing production efficiency by reducing the inefficiency of production. It is believed that it is urgent to consider how to improve productivity through public investment.
Stochastic Frontier Function Approach
Through the two preceding analyses, I examined the effect of public capital on productivity and economic growth. As a result of these analyses, it was found that public capital stock has a positive effect on the economic growth but that it does not affect productivity improvements in the Korean economy. The question arises of how we can explain this phenomenon. Would it be possible to interpret this as a result of inefficiency in production?
To answer this question, I attempt to determine whether there is inefficiency in production processes associated with public investment through equation (11). Table 12 shows the results of a stochastic frontier function analysis conducted to determine the existence of inefficiency in the production processes. Columns (1) and (2) are the results of the assessment of whether there is inefficiency in the production processers when considering the total public capital stock. Column (1) assumes a one-year time lag between the variables, and column (2) assumes a twoyear time lag. As a result, public capital stock and human capital stock have a positive effect on economic growth, similar to the results in Tables 8 and 10.
Note: Standard errors are in parenthesis and *, **, and *** indicate significance at the 10%, 5%, and 1% levels, respectively.
Next, the determination of whether there is inefficiency in production can be done from the value of λ in columns (1) and (2). As noted earlier, the errors in the stochastic frontier model consist of random error and inefficiency error, where λ = σu / σv denotes the ratio of the standard error between them. In other words, when there is no technological inefficiency, it becomes 0. However, this explains only the existence of inefficiency and does not provide an answer as to whether it plays a role in reducing inefficiency. In other words, it is uncertain as to whether inefficiency in production is due to inefficiency in public investment or inefficient distributions of other factors of production. Nevertheless, it is meaningful to determine why public investment affects only economic growth and not productivity through this analysis. In both columns, the values of λ are statistically significant at 0.840 and 2.922, which indicate that technical inefficiency exists in the production process. That is, it can be interpreted that inefficiency in production processes has a negative effect on productivity in the Korean economy.
The debate over whether public investment serves as a direct form of input to enhance production or as an indirect form to increase efficiency in the economy has long continued. Although clear conclusions have yet to be drawn, it is important to justify the role of public investment to determine its future direction. This study considers whether public investment contributes to productivity improvement or to economic growth, and whether production inefficiency exists. To this end, three different methodologies - the TFP approach, the production function approach, and the stochastic frontier function approach - are used. The findings of this study are as follows.
First, while public investment has a positive impact on economic growth, the contribution to productivity growth is not high. In the context of production inefficiency, it is stated that public investment has played a role as a direct input factor of production, and not as a productive factor. It can be interpreted that there is inefficiency of production which has a negative effect on productivity in the Korean economy.
Second, the effects of public investment on economic growth and productivity improvement differ according to the sector and period. For example, public infrastructure capital has a positive effect on economic growth, although the effect by period is not clear. R&D and IT assets since 2000 have enhanced productivity and economic growth. More interestingly, the impact of human capital also differs by period, but it has generally a positive effect on productivity improvement and economic growth. These findings provide evidence that the role of public investment appears differently depending on the sector and period assessed.
In recent years, governmental revenue has decrease due to low economic growth and welfare expenditure increases. At this time, we need to focus on efforts to secure fiscal soundness by accomplishing a restructure of the government spending. To do this, the government must move toward reducing inefficiency in the economy for public investment. In other words, efforts need to be directed not only to increase the total output but also to raise productivity as an input of production.
In addition, the government has focused on building public infrastructure for economic growth during the past decade, and has mostly invested in sectors where direct effects could be rapidly realized. As in the results of this study, it is true that the performance of public investment clearly appeared in the past. However, we should be careful about undertaking public investment in a similar manner in the future. It has been reported that the level of transport SOC stock is not lower than those of advanced economies and that marginal productivity is steadily declining. In this context, efforts should be made to allocate sectoral resources effectively under the current budget constraints. It is necessary to consider the Korean economic situation and the global economic situation at the same time. As the interest in R&D and IT sector has increased worldwide since 2000, it is notable that the increase in this type of investment in Korea has a positive effect on productivity improvement. It is likely that this stems from the basis of efficiency. Thus, resource allocation by sector must respond flexibly to global economic conditions.
Finally, it is true that human capital has played an important role in Korean economic growth, which is also proved in this study. However, it is also true that the investment in human capital has focused on quantitative expansions thus far. However, in order to cope with rapidly changing economic situations in the future, qualitative growth must be realized. Rather than trying to form quantitative human capital by raising the entrance rate of tertiary education or the employment rate unconditionally, it is necessary to make efforts to improve the quality of education in order to keep pace with changes in the global economy and industrial structure. In order to do this, it is necessary to change the existing curriculum and establish a proper education policy to introduce an advanced education system.
Although there have been tangible contributions to the discussion on public investment introduced in this paper, there are also several limitations. First, there is some controversy about standard growth accounting, as the factors of production cannot be easily aggregated due to their quality and heterogeneity. For this reason, mixed results are shown in general. Second, it is difficult to consider all factors which explain economic growth in the analysis. For example, work by Hall and Jones (1999, QJE) found that a country’s long-run economic performance depends on certain aspects of its social infrastructure, such as its institutions or government policies. Nevertheless, this study concentrates on the effect of public investment and reports that there is a limit when consider all influencing factors.
This paper is based upon Han, Sungmin, “The Effect of Public Investment on Economic Growth and Productivity,” in Public Investment for Enhancing Productivity, edited by Jaejoon Lee and Kangsoo Kim, Research Monograph, KDI, 2017 (forthcoming).
Because the data here are based on internal data from the Bank of Korea, this study reports only the growth rate of the log variables (the difference between the previous and the current year, Xt (=lnXt − lnXt−1) instead of the level variable for the summary statistics.
This equation is expressed for simplicity because the dependent and independent variables of y – β0 − βxx are identical to those in equation (10).
The entire period is divided into three sub-periods: from 1970 to 1984, from 1985 to 1999, and from 2000 to 2015. Table 3 includes the interaction of each time variable and the growth rate of public capital stock.
, , & (1977). Formulation and Estimation of Stochastic Frontier Production Function Models. Journal of Econometrics, 6, 21-37, https://doi.org/10.1016/0304-4076(77)90052-5.
(1989). Is Public Expenditure Productive? Journal of Monetary Economics, 23(2), 177-200, https://doi.org/10.1016/0304-3932(89)90047-0.
, & (1993). International Comparisons of Educational Attainment. Journal of Monetary Economics, 32, 363-394, https://doi.org/10.1016/0304-3932(93)90023-9.
, & (1994). Human Capital and Endogenous Growth Evidence from Taiwan. Journal of Monetary Economics, 34(1), 101-124, https://doi.org/10.1016/0304-3932(94)01152-4.
, , & . (2004). Mapping the Two Faces of R&D: Productivity Growth in a Panel of OECD Industries. The Review of Economics and Statistics, 86(4), 883-895, https://doi.org/10.1162/0034653043125194.
, & . (2008). Public Infrastructure and Production Efficiency in Regional Economy. The Korea Spatial Planning Review, 59, 103-117, in Korean, https://doi.org/10.15793/kspr.2008.59..005.
(1994). The myth of Asia’s Miracle. Foreign Aff, 73, 62-66, https://doi.org/10.2307/20046929.
(1994). The Myth of Asia’s Miracle. Foreign Affairs, 73(6), 62-78, https://doi.org/10.2307/20046929.
, & (2006). Analyzing the Korea’s growth experience: The Application of R&D and Human Capital Based Growth Models with Demography. Journal of Asian Economics, 17, 818-831, https://doi.org/10.1016/j.asieco.2006.08.002.
Penn World Table 9, http://www.rug.nl/ggdc/productivity/pwt/.
(2001). Public Capital and Economic Growth: A Convergence Approach. Journal of Economic Growth, 6(3), 205-227, https://doi.org/10.1023/A:1011395732433.
. (2008). Metro Cities’ and Provinces’ Total Factor Productivity and its Determinants in Korea. The Korea Spatial Planning Review, 58, 39-53, in Korean, https://doi.org/10.15793/kspr.2008.58..003.