- P-ISSN 2586-2995
- E-ISSN 2586-4130

Financial soundness in the household sector matters for financial stability and for the real economy. The level of household debt in Korea raises concern about the financial soundness of the household sector due to its size, growth rate and quality. Against this backdrop, we assess the financial vulnerability of borrowers based on an analysis of credit bureau (CB) data, in which the actual credit activities of most individuals are recorded at a high frequency in Korea. We construct over-indebtedness indicators from the CB data and then assess the predictability of forthcoming defaults. Based on the over-indebtedness indicators, we show how borrowers are distributed in terms of over-indebtedness and how the over-indebted differ from average borrowers in terms of their characteristics. Furthermore, we show how the aggregate credit risk in the household sector would change under macroeconomic distress by analyzing how each borrower’s credit quality would be affected by adverse shocks. The findings of this paper may contribute to assessing household debt vulnerability and to enhancing regulatory and supervisory practices for financial stability.
Household debt, Over-indebtedness, Credit Risk, Stress Test, Financial Stability
D12, D14, G21
Financial soundness in the household sector matters for financial stability as well as for the real economy. The global financial crisis of 2007-09 has shown how the financial soundness of the household sector can affect both the financial system and the real economy. The level of household debt in Korea raises concern over financial stability due to its large size, high growth rate and compositional quality. The amount of household debt relative to GDP (or income) is large compared to those of OECD countries, as shown in Figure 1. Household debt has been growing faster than household income, suggesting that the debt-repayment ability of households has weakened. Furthermore, the share of loans with high-interest rates from non-bank financial institutions has increased rapidly, as shown in Figure 2, while the share of balloon-payment loans is relatively large as well. In short, these phenomena give rise to concerns about household debt vulnerability. Against this backdrop, we investigate household over-indebtedness and its associated financial vulnerability based on an analysis of credit bureau (CB) data, which contain the actual credit activities of most individuals in Korea.
Note: Non-bank financial institutions in the figure include nonbank depository institutions and other financial institutions such as insurance companies, pension funds and public financial institutions.
Source: Bank of Korea.
The vulnerability of household debt at the aggregate level may be determined by how much debt is held by the overly indebted with weak repayment abilities. In other words, the larger the amount of debt held by borrowers bearing high credit risks, the larger the share of debt that could be vulnerable. In order to evaluate this issue, we need criteria by which to assess which debtors are exposed to higher credit risks. The current study constructs several common indicators of over-indebtedness from the CB data and assesses the predictability of forthcoming defaults. The CB data employed in this study cover most individuals in Korea and contain their actual credit activities, including the amount of debt and debt services, the types of debt contracts and lending institutions used, delinquencies, their credit score, and more. In order to understand who the overly indebted are, we identify them using over-indebtedness indicators and characterize the vulnerable indebted in comparison with average borrowers. Furthermore, we show how both the distribution of borrowers in terms of the credit score dimension and the aggregate default risk would be affected by sudden changes in the macroeconomic environment.
The concept of over-indebtedness may be ambiguous. Hence, it may not be easy to define what it means in practice – see Betti, Dourmashkin, Rossi, and Yin (2007) and D’Alessio and Lezzi (2013) for discussions. Nevertheless, it may be reasonable to relate the concept to a condition of difficulty in debt repayment. Over-indebtedness indicators can be assessed and compared with one another with regard to their ability to predict defaults in the forthcoming year. We examine common over-indebtedness indicators - such as the credit score, debt service ratio (DSR), the DSR of unsecured debt holders, the loan to income (LTI) ratio, and the number of credit commitments – in terms of their performance as predictors of defaults. We show that the credit score is a dominant predictor of defaults, while the number of credit commitments may have some additional explanatory power for forthcoming defaults. The DSR may have weak predictability of defaults in the forthcoming year, though it loses its explanatory power if the credit score and the number of credit commitments are controlled.
Based on the over-indebtedness indicators, vulnerable borrowers can be identified and analyzed. We document the characteristics of the over-indebted to shed some light on who they are and how they differ from average borrowers in several dimensions. Based on such primary indicators as the credit score, the number of credit commitments, and the DSR, the overly indebted are characterized. We show that most over-indebtedness indicators recount common characteristics of the over-indebted. For instance, all over-indebtedness indicators show that over-indebted borrowers tend to depend heavily on non-bank financial institutions as the sources of their loans. In addition, those classified as overly indebted in terms of one indicator tend to be classified as overly indebted by other indicators as well. However, different indicators appear to elucidate idiosyncratic characteristics of the over-indebted. For example, the over-indebted with poor credit scores tend to show lower DSRs than average, while the over-indebted with multiple credit commitments show much higher DSRs than average. Thus, caution may be needed when using those indicators for purposes of risk monitoring or supervision.
We are often asked about how the share of borrowers at risk would be affected by a sudden change in the macroeconomic environment (e.g., GDP, interest rates, asset prices). The over-indebtedness indicators can be used to assess borrowers’ credit risks at the individual as well as at the aggregate level by relating them to default probabilities. The stress test conducted in the current study may guide us to assess the financial vulnerability of the indebted at the aggregate level due to macroeconomic distress. In the current study based on CB data, we show how macroeconomic distress would affect the credit quality of borrowers as well as the aggregate default rates in household credit markets. If the historical scenarios of past financial crises such as the Asian financial crisis (’97~99) and the global financial crisis (’07~09) were assumed to reoccur, the aggregate default risk would then increase dramatically, with the larger impact resulting from the stress scenario of the Asian financial crisis, the worse macroeconomic condition. It should be noted that the stress test proposed in the current study shows uniquely how each borrower’s credit quality would deteriorate under macroeconomic distress, which in turn would change the aggregate default risk.
It is also important to note that the current study analyzes CB data, whereas many previous studies of household debt vulnerability used household survey data. The survey data are subject to certain limitations in their assessments of financial vulnerability in spite of their strengths regarding various kinds of information about household characteristics and activities, as they are subject to errors and psychological biases and use insufficient representations of their populations (Lusardi and Tufano 2009; Karlan and Zinman 2008; Zinman 2009).1 The CB data employed in the current study cover most individuals and financial institutions in Korea and contain their actual credit activities at a high frequency, with the information used by financial institutions during their loan generation processes. Thus, the CB data may provide an advantage when assessing and monitoring the levels of actual credit risk for the purpose of financial regulation and supervision relative to the household survey data. For instance, we can assess the over-indebtedness indicators for their predictability of forthcoming defaults because the CB data keep track of defaults on loans, whereas the survey data provide insufficient information on default events.
In order to assess and monitor the financial vulnerability of household debt, which may be important for prudential regulation and supervision, we often rely on stress tests that assume extremely adverse macroeconomic conditions. The stress test proposed in the current study is distinct from those in previous studies in terms of the intermediary mechanism through which macroeconomic shocks affect the aggregate credit risk of household debt. First, we use the credit score, a dominant predictor of forthcoming defaults, as a part of an intermediary channel through which macroeconomic distress affects the aggregate credit risk. Second, we shed some light on how the relationship between the over-indebtedness indicator and default rates would be affected by macroeconomic fluctuations. It should be noted that the relationship between over-indebtedness measures and default rates are not constant but may change as macroeconomic conditions fluctuate. For instance, the default rates jumped dramatically for borrowers even with constant debt servicing burdens during the global financial crisis of 2007-09 (Kim and Byun 2012). These distinct features of the stress test proposed in the current study may contribute to enhancing the assessments and monitoring of the aggregate credit risk emerging from household debt.
The remainder of this paper is organized in the following order. Previous studies are reviewed in relation to the current study in section II. Data and descriptive statistics are shown in section III. Indicators of over-indebtedness are presented and assessed for their ability to predict defaults in the near term future in section IV. Based on the preceding analysis, the characteristics of the over-indebted are discussed in section V. Stress tests are then conducted to assess the financial vulnerability of the indebted against macroeconomic distress in section VI. Concluding remarks are made in section VII.
The current study assesses the financial soundness of the household sector by analyzing CB data based on measures of over-indebtedness and a stress test, motivated by the rising level of concern over financial stability. This issue has received a great amount of attraction from central banks and financial supervisory bodies since the global financial crisis in 2007-09, leading to regular and irregular assessments of the household sector from the perspective of financial stability. Nonetheless, there is still room to improve the tools and related databases. Our approach with regard to this issue is to assess household sector credit risk at the aggregate level from an analysis of microeconomic data, as this dataset suitably represents the population and is updated at a high frequency. As argued by Mian and Sufi (2010), an analysis of such microeconomic data can shed some light on household liability issues and provide guidance to policymakers.
Household debt, the liability side of the household sector, has been somewhat neglected in the literature compared to the asset side of the balance sheet (Zinman 2015). As noted by Zinman (2015), “the neglect of household debt is pronounced relative to its cousin literatures on corporate debt.” Concerning the credit risk assessment of interest in the current study, we find a large volume of literature on corporate debt, whereas there is much less to be found on household debt. For example, we address how macroeconomic conditions would affect the credit quality of borrowers by showing how the obligors would migrate in the dimension of credit ratings. With regard to this question, we find much work on corporate debt in the literature (e.g., Trück 2008; Koopman et al. 2009; Bangia et al. 2002; Carling et al. 2007; Bonfim 2009; Altman and Rijken 2004), whereas we find few similar works on household debt in spite of the rising demand from policy circles to our knowledge. This situation may have arisen because credit risk assessment in the household sector had not received much attention until its importance was recognized in the face of the historically unprecedented large debt accumulation followed by the subprime mortgage crisis of 2007-09, while microeconomic data such as CB data have only become available in the recent years. Against this backdrop, we aim to contribute to the assessment of financial stress in the household sector.
The global financial crisis provided a critical moment for extensive reforms on financial regulation and supervision with an emphasis on macro-prudential policies (Galati and Moessner 2013; IMF 2011a; IMF 2011b; FSB, IMF, and BIS 2011; Lim et al. 2011; Bernanke 2011). An important element for effective financial supervision is to monitor and to assess emerging risks in the financial system in relation to the real economy. It should be noted that the most frequently used macro-prudential instruments in practice have been caps on LTV and DTI ratios that are aimed at borrowers from the household sector among the wide range of policy tools (Claessens 2014; Darbar and Wu 2015); suggesting that the assessment and monitoring of risks emerging from the household sector may be in high demand from regulatory and supervisory bodies. Motivated by the rising interest from policy circles, we aim to assess the credit risk emerging from the household sector in relation to macroeconomic conditions.
Various indicators and measures of household over-indebtedness or financial vulnerability have been discussed in recent studies (e.g., Bankowska et al. 2014; Bryan, Taylor, and Veliziotis 2010; Civic Consulting 2013; Disney, Bridges, and Gathergood 2008; D’Alessio and Iezzi 2014; Shubhasis 2008). We find that common indicators have been used in the form of debt levels (or debt servicing burdens) out of debt payment abilities, such as income, assets or consumption spending. For example, the ratios of debt to assets, debt to income, and debt service to income were used as indicators of household debt vulnerability by the ECB (2013) and in Costa and Farinha (2012) and Ehrmann and Ziegelmeyer (2014). Other indicators have also been explored as an extension of these common indicators. These measures include information about the cash flow aspects of income-consumption-debt repayment streams or the asset-side liquidity of balance sheets as used to assess financial vulnerability, particularly in Albacete and Lindner (2013) and Ampudia et al. (2013), among others. In addition, self-reported household-level information about overdue debt, the number of credit commitments and financial difficulty has been used to measure the seriousness of debt problems. As concerns are raised about household debt in Korea, recent studies have assessed the vulnerability of Korean household debt based on household-level survey data. Several of those studies utilized indicators of financial vulnerability based on household survey data (e.g., Kim and Yoo 2013; Karasulu 2008; Kim et al. 2014).
Most of the earlier studies on household over-indebtedness or vulnerability are based on an analysis of household survey and self-reported data, which may be subject to errors or psychological biases while the data are released with significant time lags of a few years. In contrast to these previous studies, we use credit bureau (CB) data, which contain the actual credit activities and transactions recorded in most financial institutions and are used by financial institutions for the loan generation process. Based on the CB data, indicators of over-indebtedness are constructed for each borrower. The over-indebtedness indicators of interest in the current study are the credit score, the debt-service-to-income ratio (DSR), the DSR of unsecured loan holders, the loan-to-income ratio (LTI), and the number of credit commitments. These indicators are studied for their properties and for their ability to predict defaults in the subsequent year.
The aforementioned indicators may be used to identify the over-indebted or to study the associated vulnerability levels. Once the indicators of over-indebtedness are constructed, we then analyze who the overly indebted are in terms of their characteristics based on these indicators. There are several studies that analyzed the characteristics of the over-indebted based on household survey data (e.g., Bryan, Taylor, and Veliziotis 2010, Civic Consulting 2013; Disney, Bridges, and Gathergood 2008; D’Alessio and Iezzi 2014). Because survey data contains various details about households, the data may provide very useful information about the characteristics of the over-indebted. In comparison with survey data, CB data may provide a somewhat limited range of information about borrowers’ characteristics. Nevertheless, the CB data in the current study cover most individuals and financial institutions participating in the credit market in Korea and provide accurate information about the liability side of borrowers. It is also updated at a high frequency.
We conduct stress tests on household debt to assess how the credit risk of the household sector would be affected at the aggregate level by adverse shocks to macroeconomic environments. We can find evidence in previous studies that macroeconomic conditions serve as determinants of the default risk of retail loans in banks’ portfolios, though they do not show how obligors may migrate in terms of certain aspects of the credit risk, such as credit ratings, in response to adverse shocks (e.g., Mayer et al. 2009; Agarwal and Liu 2003; Rinaldi and Sanchis-Arellano 2006; Louzis et al. 2012; Büyükkarabacak and Valev 2010). We can also find studies on stress tests for an assessment of household debt vulnerability but based on household survey data (e.g., Kim and Yoo 2013; Karasulu 2008; Albacete and Fessler 2010; IMF 2012; Shubhasis, Djoudad, and Terajima 2008). These studies use information about cash flows and balance sheet positions to identify vulnerable households. They examine how the share of vulnerable households and their debt holdings change in response to fluctuations in macroeconomic conditions. In contrast, we use prominent indicators of debt vulnerability based on CB data and examine how the credit quality of borrowers would change if the macroeconomic environment changed dramatically. It should be noted that the stress tests using household survey data in previous studies may have limitations in timely credit risk assessments due to both insufficient information about borrowers’ default events and a few years of lags until their release. As concerns about household debt have increased in Korea, several recent Korean studies have used CB data to analyze its vulnerability (e.g., Hahm, Kim, and Lee 2010; Kim, Chang, and Choi 2012; Lee et al. 2014). However, these previous studies which rely on CB data ignored how macroeconomic conditions would affect the dominant predictors of defaults, instead focusing on indicators which only weakly predict defaults. It is also important to note that the current study sheds some light on how the relationship between the over-indebtedness measure and default rates would change in the face of adverse macroeconomic conditions. These features of the stress test conducted in the current study may enhance the risk assessments and monitoring of household credit risk at the aggregate and at the obligor level.
We use data from the National Information and Credit Evaluation (NICE) CB to analyze the vulnerability of Korean household debt. The CB dataset contains actual credit activities from most financial institutions and covers most household loans in Korea.2 It contains information such as individual characteristics, debt contracts, delinquencies, types of lending institutions, and estimated incomes. We sample nearly one million individuals from the CB data in the analysis; hence, they are assumed to constitute a nationally representative random sample of individuals with credit records. Table 1 presents descriptive statistics pertaining to the sample data set, including the sample sizes, estimated incomes, ages, credit scores, debt amounts and DSR and LTI values. We note that high-income groups tend to have more borrowers with larger amounts of debt and debt service levels but better credit scores and lower default rates as well in comparison with other income groups.
Note: a) Incomes in the table are on an annual basis. b) Default rates are the ratio of those who are not currently in default but experience a default within one year.
As a criterion to define over-indebtedness and to assess the financial vulnerability of debt holders, we use the likelihood that borrowers will not repay their debt or interest. In particular, the likelihood of being in arrears for more than 90 days during the subsequent year is used as a criterion to assess the extent of over-indebtedness. In other words, the more borrowers are exposed to default risks, the more they are considered to be overly indebted. We examine such indicators as the credit score, the DSR, the DSR of unsecured loan holders, the LTI, and the number of credit commitments, after which we assess their ability to predict defaults in the forthcoming year.
Regarding the credit score, borrowers are divided into ten groups from the lowest to the highest credit quality based on the NICE credit scoring system. The debt service to income ratio (DSR) is computed as the debt-servicing burden out of income, estimated based on the CB data, as recommended by the Financial Supervisory Commission (FSC). DSR ratios are also computed for unsecured loan holders. Loan to income ratios (LTI) are computed as the ratio of outstanding debt out of the estimated individual incomes. The number of credit commitments refers to how many financial institutions each borrower is indebted to at the moment.
Based on the indicators of over-indebtedness, we note how borrowers are distributed on the spectrum of each measure, as shown in Figure 3. Regarding the credit score, nearly 70% of borrowers are rated at equal to and above the fifth credit score, while the remaining 30% of borrowers are rated equal to or below the sixth credit score. We also find that the share of borrowers in each group of credit scores decreases as credit scores deteriorate for the remaining 30% of borrowers. Regarding the DSR, approximately 70% of borrowers have DSRs below 40%, while the remaining 30% have DSRs higher than 40%. We also observe that the number of borrowers decreases as the DSR increases. With respect to the DSR of unsecured debt holders, about 80% of borrowers with unsecured loans have DSRs below 30%, with the remaining 20% having DSRs higher than 30%. Again, the share of borrowers with unsecured loans decreases as their DSR increases. Regarding the LTI, nearly 80% of borrowers have LTIs lower than 200%, and the number of borrowers decreases as the LTI increases. Approximately 80% of borrowers have loans from less than or equal to two financial institutions while the remaining 20% of borrowers have loans from more than or equal to three financial institutions.
We analyze how over-indebtedness indicators are related to default rates in the near-term future in order to assess how well they reflect borrowers’ default risk. Indicators that show a strong and clear relationship with the default rate in the forthcoming year may be preferred over indicators that do not show such a relationship. In addition, an indicator of over-indebtedness can be compared with other indicators in terms of their ability to predict a default. In the current study, a state of default is defined as being in arrears for more than 90 days. By computing the frequency of defaults in the forthcoming year corresponding to different values of over-indebtedness, we can quantify the relationship between the over-indebtedness indicators and the rates of default in the subsequent year. We assess over-indebtedness indicators such as the credit score, the DSR, the DSR of unsecured debt holders, the LTI, and the number of credit commitments for their association with default rates in the forthcoming year.
In the following, we analyze how well the over-indebtedness indicators predict the frequency of defaults in the subsequent year.3 Borrowers credit-rated from the sixth to the tenth levels show higher than average default rates in the forthcoming year, as shown in Figure 4, while borrowers credit-rated from the eighth to the tenth record default rates above 20%, much higher than the average default rate. Borrowers with DSRs above 40% record default rates in the subsequent year higher than average, as shown in Figure 4. The default rates of borrowers tend to increase very slowly as the DSR increases. Changes in the DSR do not significantly influence changes in default rates in the subsequent year. In fact, the association between changes in default rates and changes in the DSR appear much weaker as compared to the credit score. With respect to the DSR of unsecured loan holders, those with DSRs higher than 30% record default rates in the forthcoming year higher than average, as shown in Figure 4. However, the overall pattern of default rates associated with the DSR of unsecured loan holders is similar to that of the general indebted. Regarding the LTI, borrowers with LTIs above 600–700% record default rates in the next year higher than average, as shown in Figure 4. The default rates of borrowers tend to increase very slowly in the LTI range above 300–400% as the LTI increases. However, changes in the LTI do not appear to show a significant association with changes in default rates in the subsequent year. For instance, default rates do not change much in the LTI range up to 700%, as shown in Figure 4. Multiple credit commitments are shown to be strongly associated with default rates in the near future. Borrowers with loans from up to two financial institutions show default rates lower than or similar to the average in the subsequent year, as depicted in Figure 4. However, their default rates become higher than average if the number of credit commitments reaches three. Default rates become much higher than average for borrowers with loans from four or more financial institutions. Thus, the number of credit commitments may serve as a useful predictor of default in the near future.
The credit risk of borrowers may be better characterized by a combination of over-indebtedness indicators than by a single indicator. Thus, it may be valuable to analyze how borrowers are distributed and how are associated with default rates in multiple dimensions of the over-indebtedness indicators. With respect to the multidimensionality of both credit scores and credit commitments, a large share of borrowers can be found among those with relatively better credit scores and fewer credit commitments, as shown in Figure 5. With respect to the multidimensionality of both credit scores and DSRs, more borrowers exist in a region of relatively better credit scores and lower DSRs, as shown in Figure 5. Regarding the multidimensionality of both DSRs and the number of credit commitments, a large proportion of borrowers are found among those with fewer credit commitments and relatively lower DSRs.
The likelihood of defaults may also be evaluated in multiple dimensions combining multiple indicators of over-indebtedness. The default rates in the forthcoming year appear most strongly associated with the credit score out of the indicators of the credit score, the DSR, and the number of credit commitments, as shown in Figure 6. If the DSR and the number of credit commitments are compared with regard to their ability to predict default, the number of credit commitments is more strongly associated with the default rate. Note that the number of credit commitments may still contain some explanatory power for defaults in the near future, even with credit scores controlled, as shown in Figure 6. In contrast, the DSR does not show a clear pattern in relation to default rates if the credit scores are fixed, as shown in Figure 6. In short, the credit score can be used as a dominant predictor of the default rates in the forthcoming year, while the number of credit commitments has some additional explanatory power with regard to default rates even when credit scores are taken into account.
Thus, the credit score may be the dominant predictor of default in the forthcoming year, while the number of credit commitments may have some additional predictability. The DSR may carry some information about default risk; however, it loses its explanatory power to predict a default in the near future if better predictors such as the credit score and the number of credit commitments are taken into account. Table 2 shows how the over-indebtedness indicators are correlated with one another. Credit scores show a positive association with the number of credit commitments, implying that borrowers with poorer credit rates tend to borrow from a larger number of financial institutions. Meanwhile, the debt burden ratio indicators of the DSR and LTI are not clearly related to credit scores, whereas they are weakly and positively correlated with the number of credit commitments. In other words, the amount of debt or the debt service burden relative to income may not necessarily provide information about their credit score, whereas higher debt-burden ratios in terms of the DSR and LTI are positively associated with the number of credit commitments. The DSR and LTI are highly correlated with each other, implying that the information delivered by the respective indicators may overlap somewhat.
Note: p-values of all correlation coefficients are less than 0.0001.
We estimate simple logistic regression models in order to assess the predictability of the over-indebtedness indicators for defaults in the forthcoming year. The regression results from (1) to (4) in Table 3 show that all indicators are statistically significant, although the suitability of each indicator differs significantly from one another. Regression (1) shows that the credit score alone has excellent predictability with regard to a default in the subsequent year according to the C-statistic (above 0.8).4 The regression results of (2) and (3) show that the DSR or LTI may not be useful predictors by themselves according to the C-statistic (close to 0.5), while LTI is virtually uninformative about forthcoming default events. In addition, the LTI coefficient estimate is even unstable across prediction models, as depicted by (3) in comparison with (5), for example. Regression (4) indicates that multiple credit commitments show good predictability of defaults, although the predictability is weaker than that of the credit score. Regression (5), including all of the indicators, shows improved predictability compared to all other regression models, though it is only slightly better than model (1). In short, we find that the credit score is the dominant predictor of default in the near future. Including additional over-indebtedness indicators such as the number of credit commitments and the DSR and LTI in the regression specification may improve the predictability, but only slightly. We also find that the regression results appear consistent with the pattern of default rates, as shown above in the various dimensions of the over-indebtedness indicators. It should be noted that the assessment of the indicators is for their short-term (one year) predictability of defaults. The predictability of DSR and LTI, which are considered to reflect fundamental repayment capability of debtors, may improve over a longer time horizon.
It is important to understand who the overly indebted are in order to design policies to deal with household debt problems. The findings above demonstrate that the over-indebtedness indicators can predict near-term defaults but with different strengths of predictability. Credit scores are strong in terms of their ability to predict defaults, while the number of credit commitments and DSR may provide some additional information on the likelihood of a default. Below, we analyze how the over-indebted in terms of the credit score, the multiple credit commitments and the DSR are characterized in comparison with average borrowers. Over-indebted borrowers are analyzed on several metrics, including their age, income, debt level, geographical residence area, lending institutions, and on other metrics relevant to the overly indebted.
First, borrowers with poor credit ratings are compared with borrowers with better credit ratings and with average borrowers, as shown in Table 4. There does not appear to be a significant difference in age between borrowers in the different credit ratings groups. Borrowers rated below the seventh credit score represent about 19% of all borrowers. They tend to have smaller income and debt levels than those with better credit ratings. Their residences are generally equally distributed between the capital area and other regions, while borrowers with better credit ratings are concentrated somewhat more in the capital area than in other regions. Nearly two thirds of borrowers with low credit ratings borrow only from non-bank financial institutions, while 12% of them borrow only from banks. In contrast, about half of borrowers with better credit ratings borrow only from banks, while one third of them borrow only from non-bank financial institutions. Borrowers with low credit ratings tend to have more credit commitments than those with better credit ratings. Nevertheless, they show much lower DSRs and LTIs than those with better credit ratings due to their much smaller debt amounts.
Second, borrowers with multiple credit commitments are compared with those who have fewer credit commitments in Table 4. There appears to be a trivial difference in age between those with more credit commitments and those with fewer. Borrowers with three or more credit commitments represent nearly 19% of all borrowers. They tend to have levels of income similar to that of the average borrower but much higher levels of debt than the average borrower. Thus, their DSRs and LTIs are much higher than average. They are concentrated slightly more in the capital area than in other regions. They show a very high dependence on non-bank financial institutions in comparison with the average borrower; 34% of them borrow only from non-bank financial institutions and 59% of them borrow from both banks and non-bank financial institutions. Borrowers with multiple loans tend to have worse credit ratings compared to the average borrower.
Third, borrowers with heavier debt burdens in terms of the DSR are compared with borrowers with lighter debt burdens in Table 4. Borrowers with heavier debt burdens are four years older than those with less debt. Borrowers with DSRs above 60% comprise approximately 16% of all borrowers. They tend to have levels of income similar to that of the average borrower but a much higher level of debt. Thus, their DSRs and LTIs are much higher than average, even multiple times higher. Their residences are distributed slightly more in the capital area than in other regions. There does not appear to be a significant difference in terms of residential region between borrowers with a high DSR and the average borrower. High-DSR borrowers show high dependence on non-bank financial institutions when they borrow. It was found that 39% of them borrow only from non-banks and 37% of them borrow from both banks and non-banks. In addition, they tend to borrow from more financial institutions. Nevertheless, they do not show a significant difference in terms of their credit scores when compared with those less burdened with debt, indicating that high-DSR borrowers may not necessarily be riskier than the average borrower according to their credit scores.
We have documented the characteristics of the over-indebted to shed light on who the over-indebted are and how they differ from average borrowers in several dimensions. We find that most over-indebtedness indicators recount the common characteristics of the over-indebted. For example, over-indebted borrowers tend to depend heavily on non-bank financial institutions as sources of their loans. In addition, those classified as overly indebted in terms of one indicator tend to be classified as overly indebted by other indicators as well. However, it is important to note that different indicators appear to elucidate the idiosyncratic characteristics of the over-indebted. For instance, the over-indebted with poor credit scores tend to have lower DSRs than average, while the over-indebted with multiple credit commitments have much higher DSRs than average. Thus, special caution needs to be exercised regarding the appropriate use of over-indebtedness indicators for financial supervision or risk-monitoring purposes.
We are often asked about how adverse shocks to the economy would affect the amount of credit risks to which borrowers are exposed at the aggregate level, which would then affect the soundness of financial institutions with the risky loans in their asset portfolios. In order to answer this question, we may conduct stress tests, which may be a useful tool for assessing financial vulnerability from a forward-looking perspective. By relating the degree of over-indebtedness to the probability of default (PD), we may be able to compute borrowers’ exposure to default risk at the aggregate level and analyze how they are expected to change in response to shifts in the macroeconomic environment. For example, we may compute the frequency of defaults associated with each credit score (CSi); hence, borrower i ’s credit score (CSi) can indicate his/her probability of default (PDi). If each borrower i were assigned a probability of default (ܲPDi) based on the relationship between their over-indebtedness and its corresponding default rates, the average likelihood of default would then be computed by (∑i PDi) / N, where N is the total number of borrowers. This expression indicates that the aggregate credit risk would increase if more borrowers were associated with higher probabilities of default. To assess the financial vulnerability of the indebted, we conduct the following stress test. First, stress scenarios reflecting macroeconomic distress are juxtaposed against baseline scenario. Stress scenarios may reflect hypothetical changes in macroeconomic environments (e.g., the GDP, interest rates, and asset prices, among others). They may be based on specific historical events (e.g., the Asian financial crisis, the global financial crisis) or on a distribution of macroeconomic variables of interest. Next, a shift in macroeconomic conditions changes the distribution of borrowers in terms of over-indebtedness. Because over-indebtedness is associated with the probability of default, the distributional change in the over-indebtedness dimension would reassign a new probability of default (PDi) to each borrower i . The new PDi reassigned to each borrower i may allow us to predict the average default rates under the stress scenario.6 If more borrowers were associated with more over-indebtedness, the share of borrowers exposed to higher levels of credit risk would then increase. In short, a shift in macroeconomic conditions may affect the aggregate credit risk in terms of the average probability of default by changing the distribution of borrowers in terms of over-indebtedness.
Because the credit score is the dominant predictor of default in the near future among the over-indebtedness indicators discussed above, we analyze below how the distribution of borrowers would change in the credit score dimension if the economy were hit by an adverse macroeconomic shock.7 Suppose that the credit score is related to the amount of risk in a straight-line relationship, as depicted in Figure 7, where the risk amount may be measured by ln(odds) = ln((1 − p) / p), where p denotes the borrower default rate. Macroeconomic distress may change the relationship between the credit score and the risk amount (RA). We may decompose the change in the relationship into a change in the intercept and a change in the slope. Figure 7 shows how the change in the relationship from (1) to (2) may be decomposed into the intercept change and the slope change. A change in the intercept may reflect equal changes in the amount of risk at each credit score, while a change in the slope may reflect unequal changes in the amount of risk across different credit scores - see Capuzzo (2011) for a conceptual discussion and some applications. We may capture the change in the relationship by changes in credit scores in order to keep each credit score associated with a certain amount of risk. In other words, macroeconomic distress would change the distribution of borrowers in the credit score dimension, i.e., credit migration, if we would like to keep default rates associated with each credit score fixed.
The baseline scenario and the stress scenario are denoted here as t0 and t, respectively. The relationship between the credit score (CS) and ln(odds) under the baseline scenario (t0) may be written as ln(odds)t0 = βt0CSt0 + αt0, while the relationship between the credit score (CS) and ln(odds) under the stress scenario (t) may be written by ln(odds)t = βtCSt + αt . If the macroeconomic environment shifted from the baseline to the stress scenario, the relationship between the credit score (CS) and ln(odds) would change and could then be represented by a change in α (Δα ≡ αt − αt0) and a change in β (Δβ ≡ βt − βt0). Because we would like to keep the risk amount associated with each credit score fixed, the change in the risk amount should be captured by the risk-equivalent change in the credit scores. We can compute the risk-preserving credit score change (ΔCS ≡ CSt − CSt0) by solving βt0CSt0 + αt0 = βt(CSt0 + ΔCS) + αt. This equation can be rearranged for ΔCS, which can be expressed in terms of Δα and Δβ as shown below.
This equation can also be written as CSt0 = (βt / βt0)CSt + Δα / βt0 to show how the credit score at t (CSt) is related to the risk-equivalent credit score at t0 (CSt0). Equation (1) indicates how changes in the intercept (Δα) and in the slope (Δβ) may lead to changes in credit scores (ΔCS).
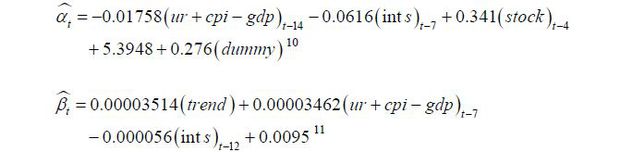
If αt and βt were given as functions of the macroeconomic variables (Xt), i.e., Fα(Xt) and Fβ(Xt), respectively, the shift in the macroeconomic condition would then change the credit score according to equation (1). In order to compute the change in the credit score, αt and βt may need to be estimated as functions of the macroeconomic variables (Xt). Note that Fα(Xt). and Fβ(Xt) can be estimated for mortgage borrowers and other borrowers separately in order to take differences in risk characteristics into account. Figure 8 shows the time series of αt and βt for mortgage borrowers. In this paper, αt and βt are estimated as functions of macroeconomic conditions (Xt) consisting of the misery index (unemployment rate + inflation rate − GDP growth rate), corporate bond yields, and stock returns, among other factors.8 Below are the estimated models for αt and βt for mortgage borrowers.9
According to the estimation results of αt, the misery index and interest rates tend to decrease ln (odds) while stock returns tend to increase ln (odds), consistent with our sense of the credit risk, noting that ln (odds) is inversely related to the level of default risk.
If αt and βt were given as estimated functions of the macroeconomic variables, respectively, the change in the macroeconomic condition (Xt0 → Xt) would then bring about changes in the credit score (CSt0 → CSt) according to equation (1). As each borrower’s credit score changes, the distribution of borrowers in terms of their credit scores would then change. If borrowers were redistributed in this credit score dimension, each borrower i would be reassigned a new PD(PDi,t) corresponding to their new credit score (CSi,t). We can then compute the average PD under the stress scenario by (∑i PDi,t) / N, as discussed above. In short, we may be able to predict how the distribution of borrowers would change in terms of the credit score and how the aggregate default risk would change in terms of the average PD if macroeconomic conditions worsened.
We show the stress test results for the aggregate credit risk below while assuming a reoccurrence of historical events, such as past financial crises. The stress scenarios of interest may be macroeconomic conditions during the period of past crises such as the Asian financial crisis of 1998-99 (AFC) and the recent global financial crisis of 2008-09 (GFC).12 Figure 9 shows how the distribution of borrowers would change in terms of the credit score dimension against the baseline scenario if each historical stress scenario reoccurred. We find that macroeconomic distress would redistribute borrowers from better credit scores to worse credit scores. It was also found that more migration would occur from the upper to the middle credit score range while less migration would occur from the middle to the lower credit score range. In addition, the impact of stress scenarios on the credit migration would be much stronger for the case of the Asian financial crisis, the relatively worse macroeconomic condition. As borrowers migrate into credit score regions of higher default probability ( PD ) levels, the overall credit risk is expected to increase. Figure 9 shows that the aggregate credit risk in terms of the average PD would increase if macroeconomic conditions shifted from the baseline to each historical stress scenario of the past crises.
It is important to note that the stress test proposed in the current study utilizes the dominant predictor of default as an intermediary channel through which macroeconomic conditions affect the aggregate default rates. In the current stress test model, macroeconomic shocks affect the aggregate credit risk level by changing the distribution of borrowers in terms of their credit scores, which is strongly associated with default rates. In addition, we take into account the impact of macroeconomic fluctuations on the relationship between the over-indebtedness indicator and default rates. These features of the current stress test are distinct from those in previous studies that also used CB data but that utilized DSRs or LTVs as main variables in the intermediary channels, which are weakly associated with default rates, as noted in Table 3.13 Changes in such indicators as the DSR, LTI, or LTV may only partially explain the movement of default rates, as also noted by Kim and Byun (2010) and Choi and Park (2015), among others. In addition, the relationship between such over-indebtedness indicators and subsequent defaults was often assumed to be constant in earlier work, thus resulting in little change in the default rate even against severely depressed macroeconomic scenarios.
The current study assesses the vulnerability of household debt based on an analysis of obligor-level information from CB data. We construct over-indebtedness indicators from the CB data and assess their capability to predict defaults in the near future. Based on the over-indebtedness indicators, we show how borrowers are distributed in terms of over-indebtedness and how the over-indebted differ from average borrowers in terms of their characteristics. Furthermore, we conduct a stress test on household debt to assess the vulnerability of borrowers and show how the aggregate credit risk would change under severe macroeconomic distress such as that which occurred in past financial crises (the global financial crisis and the Asian financial crisis).
The global financial crisis of 2007-09 has shown us that the rising risk from burgeoning household debt in association with real estate bubbles could damage the financial stability with large disruptions to the real economy and lead therefore to extensive reforms on financial regulation and supervision afterwards. In order to implement effective policies for financial stability, the collection of information and the monitoring of emerging risks have been strongly emphasized, as discussed above. The findings of this paper may contribute to this end by providing practical guidance for assessing the vulnerability associated with the burgeoning household debt, which is a notable risk factor challenging the financial stability of Korea. It is also important to note that the CB data used in the current study cover most individuals and financial institutions in Korea and are updated at a high frequency, thus allowing for timely assessments of credit risks. The stress test conducted based on the CB data allows us to assess the household credit risk at the aggregate level while showing us how the distribution of obligors in terms of the credit risk (ratings) dimension would change in response to adverse shocks. This distributional feature of the risk assessment measure may also help financial institutions with the retail loans in their portfolios for their risk management practices.
An earlier draft of this paper was presented at the KDI International Conference “Household Debt from an International Perspective: Issues and Policy Directions” on 10 July 2015. The authors would like to thank Jong Chil Son and other participants at the conference for their helpful comments. Thanks also to two anonymous referees and the editorial committee for their useful comments. The opinions expressed herein are those of the authors and do not necessarily reflect the official views of KDI or NICE.
In addition, the CB data are updated at a higher frequency, up to the most recent period, in contrast to the survey data; hence, this data may be a useful source of information for risk monitoring and supervisory practices.
These encompass nearly every type of financial institution operating in Korea, including domestic banks, branches of foreign banks, securities companies, insurance companies, savings banks, credit card leasing and finance companies, agricultural and fisheries cooperatives credit unions, and community credit cooperatives.
The frequency of defaults within the subsequent year is computed as the ratio of those who are not currently in default but experience a default within the next one year.
The C-statistic can be used to evaluate model predictability. It ranges from 0.5 to 1. If the C-statistic is close to 0.5, the model is interpreted as not useful for predictions.
The cut-off levels for over-indebtedness in the above analysis are the seventh rating for the credit score, 3 for the number of credit commitments, and 60% for the DSR. Those with a credit score equal to or less than the seventh credit rating tend to record high default rates, while they may have difficulty to obtain an unsecured loan from a bank. Those with loans from three or more financial institutions are often categorized as ‘borrowers with multiple credit commitments’ and tend to show high default rates, as shown in Figure 4. The DSR is related to default rates, but it may not be as good a predictor as the credit score or the number of loans. Nevertheless, DSR may represent potential risk on a longer time horizon, while those with high DSRs beyond 50-60% may have difficulty obtaining a mortgage.
In turn, we may assess how much bank assets are exposed to the default level of risk, although we do not assess the impact on the soundness of bank assets in this paper. That is, the change in borrowers’ credit risk would affect the balance sheets of the banking sector in terms of exposure at default (EAD) and expected loss (EL).
Note that the credit score alone is similar in terms of predictability to the prediction model including all the indicators together, as shown in Table 3.
Similar macroeconomic variables have been used to explain default rates of retail loans in BOKST-07, one of stress test models of the Bank of Korea – see Moon (2008) for details.
In the estimation models, ur, cpi, gdp, ints, and stock denote unemployment rates, CPI inflation rates, GDP growth rates, interest rates (nominal), and stock returns (nominal) at a monthly frequency, respectively. GDP growth rates at a monthly frequency are computed by interpolating the quarterly GDP growth rates.
R2=0.48. The model includes a dummy variable to reflect the upgrade of the credit scoring system at 2010.
As stress scenarios, the GDP growth (%), unemployment (%), inflation (%), KOSPI returns (%) and 3yr. corporate bond yield change (%p) are assumed to be −0.5, 4.7, 6, −21 and 7.8 for the AFC, and 1.4, 3.3, 4.3, −32 and 1.2 for the GFC, respectively. The historical stress scenarios correspond to the periods that maximize the PD.
See Hahm, Kim, and Lee (2010); Kim, Chang, and Choi (2012); and Lee, Jun, Chung, and Byun (2014) for related previous studies which use CB data.