
The Productivity Dispersion of the Korean Manufacturing Industry and Macroeconomic Allocation Efficiency Measures
Abstract
According to the macroeconomic allocation efficiency measure, particularly based on the methodology of Hsieh and Klenow (2009), Korea’s allocation efficiency in the manufacturing industry deteriorated in the 2000s compared to that in the 1990s. This study compares the potential TFP gain when resource allocation is removed, an indicator of allocation inefficiency according to Hsieh and Klenow (2009), and the productivity dispersion in the Korean manufacturing industry. It finds that the TFP gain may be better explained by TFP dispersions rather than proxies related to factors of distortion. The findings imply that we should investigate the sources of TFP dispersion rather than the sources of distortion to explain increases in the TFP gain (or TFP loss), which is considered as allocation inefficiency in the literature.
Keywords
Misallocation, Total Factor Productivity (TFP), Productivity Dispersion
JEL Code
O11, D24
I. Introduction
Identifying the sources of productivity differences across countries has been an essential subject in studies of economic growth. Recently, numerous theoretical and empirical studies have been devoted to increasing our understanding of differences in productivity levels across countries by exploring the effects of the misallocation of resources on aggregate economic performance, particularly the total factor productivity (TFP). These researchers include Restuccia and Rogerson (2008); Alfaro, Charlton, and Kanczuk (2008), Hsieh and Klenow (2009); and Bartelsman, Haltiwanger and Scarpetta (2013). Their studies introduced the interplay between heterogeneous establishments (plants from now) and productivity in the model and argued that misallocations of resources could have a significant effect on productivity and thus on the economic performances of countries.
Restuccia and Rogerson (2008) formulated a version of a growth model which introduced output distortions such as taxes and subsidies, which may be correlated with the productivity parameters of plants.1 They calculated the effect of distortion based on steady-state calibrations of the U.S. economy and found that distortions which create heterogeneity in the prices faced by individual producers decrease the TFP in the range of 30 to 50 percent. Alfaro, Charlton, and Kanczuk (2008) used a method similar to that of Restuccia and Rogerson (2008) and calculated the effects of misallocations on economic performance levels across countries. They found that the effects of misallocations explains approximately 60% of the log variance of income per worker. They assumed the U.S. economy as relatively undistorted and compared the distortion factors of countries with that of the U.S. Hsieh and Klenow (2009) identified both output and capital distortions and quantified the TFP loss, that is, the potential gain on aggregate TFP, without resource misallocation. Instead of using a calibration technique, they calculated the potential loss of TFP due to misallocations of resources in China and India and found that TFP losses were 30-50% in China and 40-60% in India compared to hypothetical situations in which capital and labor in China and India may be allocated to equalize marginal products as in the U.S.
The essence of these models is that distortion may prevent the equalization of the marginal value of inputs across firms. Roughly speaking, without distortions, plants with higher TFP levels tend to employ more factors of production, which would result in higher TFP. Thus, this type of model was employed to study the effects of size-dependent policies on TFP, as there is a tendency for larger plants to have higher TFP empirically.2 Guner, Ventura and Xu (2008) studied a simple growth model with an endogenous size distribution of plants and found that policies that reduce the average size of large plants by 20% lead to a reduction in output per plant by as much as 25.6%. They introduced capital distortion correlated with the size of the plant and used a calibration method with different size distributions of plants with regard to TFP.
To summarize the results of these studies, first, larger distortions have large negative effects on productivity. Secondly, distortions that result in reallocations of the factors of production from plants with higher TFP to those with lower TFP are detrimental to productivity. These studies, which raised the importance of resource allocation on TFP, motivated subsequent studies to investigate the effects of resource allocation in individual countries. Bellone and Mallen-Pisano (2013) used the methodology of Hsieh and Klenow (2009) to compare the allocation efficiencies of France and the U.S. They found that the potential TFP gain in France, around 30% in 2005, is less than that in the U.S., which was 42.9% in 1997, and that it stayed at that level without much change between 1998 and 2005. Hosono and Takizawa (2012) and Fuji and Nozawa (2013) also applied the methodology of Hsieh and Klenow (2009) to the Japanese manufacturing industry, finding that the potential gain increased sharply in the 2000s. Before the 2000s, the potential gain was less than 20%, but it increased to 50% in 2008, implying that there was a sharp rise in allocation inefficiency in Japan starting in the late 1990s.
Several previous works used the methodology of Hsieh and Klenow (2009) to examine the Korean manufacturing industry. Lee, Hwang and Seol (2013) calculated the potential TFP loss, finding that it was 7.6% in 1992 but increased to 25.3% in 2008. Interestingly, the allocation efficiency in Korea continued to decline starting in the 1990s, as in Japan. Ji and Jeong (2015) also used the same methodology and found a similar result, i.e., that the allocation efficiency deteriorated sharply in the 2000s. They aligned the calculation to be consistent with that in Hsieh and Klenow (2009) using the parameter of the U.S. manufacturing industry under the assumption that U.S. manufacturing is relatively less distorted. They found that the potential gains of the Korean manufacturing industry were 50.1% in 1997, 58.4% in 2005 and 73.1% in 2012. These figures are much larger than those in Lee, Hwang and Seol (2013), as the parameters of the production function are different. They blamed the underinvestment of firms with higher productivity levels and the survival of firms which excessively use resources w relative to their productivity level for the deteriorating allocation efficiency. Particularly, they pointed out that large firms and young firms with high productivity levels tended to produce less than the optimal level. Oh (2014) also found results similar to those in the two aforementioned studies, showing that the gap between actual GDP and optimal GDP while assuming efficient allocation increased from less than 30% in 1990 to 40% in 2012.
Is it possible that allocation efficiency in Korea and Japan is much worse than that of U.S. manufacturing while the shares of exports by Korea’s and Japan in the world market have increased rapidly relative to the U.S.? This stands in contrast to the implication of the model by Melitz (2003), which provided important ideas about the relationship between intra-industry reallocation and aggregate industry productivity for those engaged in this line of research. According to Melitz (2003), exposure to trade will induce more productive firms to enter the export market and force the least productive firms to exit. Further increases in the industry’s exposure to trade may lead to additional inter-firm reallocations toward more productive firms. Is it possible that Korea and Japan’s allocation efficiency levels deteriorated sharply in the 2000s, particularly since 2003, while those of other countries such as the U.S. and France remained mostly steady? Why did the problem of zombie firms worsen allocation efficiency suddenly after the ten-year period of stagnation in Japan? Why did Korea’s allocation efficiency deteriorate as Japan’s did in the 2000s despite the fact that Korea did not have such a prolonged period of stagnation as Japan?
In this study, we attempt to find feasible explanations for the deteriorating allocation efficiency measure, i.e., potential TFP gains, in the last 20 years in Korea’s manufacturing industry by looking into the potential TFP gains of the Korean manufacturing industry at the sectoral level rather than the aggregate manufacturing industry. This study will suggest that the TFP gains in the 2000s in Korea may be better explained by the rising TFP dispersion, although resource misallocations may have had a minor effect. Particularly, countries with large export manufacturing industries underwent a significant rearrangement of their industrial production through outsourcing and offshoring starting in the 1990s. Particularly, manufacturing in East Asia increased in terms of its global production share rapidly, and this new form of international specialization occurred in that region more than anywhere else in the world. Particularly, the rise of Chinese manufacturing played a pivotal role in this process, having an unprecedented impact on Korea’s manufacturing industry. As long as we do not understand the patterns and causes of the changing productivity dispersions, it is not a proper judgment to pinpoint rising resource misallocation as a cause of the slowdown in TFP growth in the 2000s based on the indicator of resource allocation developed in recent studies such as that by Hsieh and Klenow (2008).
In the next section, we use the methodology of Hsieh and Klenow (2008) to calculate the degree of distortion in the Korean manufacturing industry. We calculate the potential TFP gains of subsectors of the manufacturing industry along with the aggregate TFP gains possible without distortions. Here, we discuss the basic assumptions and limitations of the model used to compare allocation efficiency levels across countries or at different times.
In section III, we explore the patterns in the productivity dispersions Korea since the 1980s and examine the relationship between the potential TFP gains and TFP dispersions. In section IV, we discuss the possible determinants of the TFP gain in the Korean manufacturing industry as measured by the methodology of Hsieh and Klenow (2009). The conclusion follows in section V.
II. The Degree of Resource Misallocation Measured as Potential Gains based on Hsieh and Klenow (2009)
In this section, we use the methodology of Hsieh and Klenow (2009) to calculate the potential TFP gains in the Korean manufacturing industry and its
subsectors when resource misallocation is removed.3 This methodology is based on the model of monopolistic competition with heterogeneous
firms which produce differentiated products.4 The final good Y of the manufacturing industry is the combination of the output Ys of S sectors in the industry using a Cobb-Douglas aggregate,  , where
  . The output of each sector in the industry is a CES aggregate of Ms differentiated products such that
 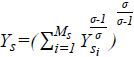 .5 The production function for each product is specified as a Cobb-Douglas function
such that Ysi = AsiKsiαsLsi1-αs. It is based on the assumption that the capital share, αs, does not differ across firms but may differ across sectors. From this, we note that
the labor and capital income shares of each firm are identical regardless of Asi as long as there is no distortion. Each firm hires the factors of production, capital
and labor, to maximize its profit, and thus the demand for each factor is affected
by market distortions. This situation leads to the difference in the income shares
of firms within a sector.
.5 The production function for each product is specified as a Cobb-Douglas function
such that Ysi = AsiKsiαsLsi1-αs. It is based on the assumption that the capital share, αs, does not differ across firms but may differ across sectors. From this, we note that
the labor and capital income shares of each firm are identical regardless of Asi as long as there is no distortion. Each firm hires the factors of production, capital
and labor, to maximize its profit, and thus the demand for each factor is affected
by market distortions. This situation leads to the difference in the income shares
of firms within a sector.
The model introduces distortions that affect the both capital and labor, as we note the profit of each firm such that πsi = (1−τYsi) PsiYsi−wLsi−(1+τKsi) RKsi, where Psi, w, and R are the output price, wage and rental price of capital, respectively. τYsi denotes the output distortion. A positive values of τYsi implies the existence of unfavorable factors which restrict the expansion of firms, such as government regulations and higher corporate income taxes. However, a public output subsidy would lower τYsi. τKsi denotes the capital distortion that raises the marginal product of capital relative to labor. A positive τKsi implies the existence of unfavorable factors which increase the cost of capital. An inexpensive policy credit will lower τKsi for firms but difficult access to credit will raise it.
The capital and output distortions, τKsi and τYsi, can be inferred from the condition of profit maximization as 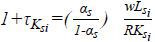 and
and 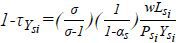 . Thus, τKsi is the discrepancy between the labor and capital income ratio of a plant relative
to what one would expect from the output elasticities with respect to capital and
labor. τYsi is the discrepancy between a firm’s labor income share and output elasticity relative
to labor, which equals the labor income share of the sector to which the firm belongs.
. Thus, τKsi is the discrepancy between the labor and capital income ratio of a plant relative
to what one would expect from the output elasticities with respect to capital and
labor. τYsi is the discrepancy between a firm’s labor income share and output elasticity relative
to labor, which equals the labor income share of the sector to which the firm belongs.
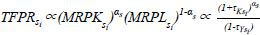
Following Foster, Haltiwanger and Syverson (2008), the model distinguishes between physical and revenue productivity. Under monopolistic
competition, physical productivity is negatively correlated with output prices, while
revenue productivity is positively correlated with output prices. Therefore, the distortions
which affect the prices appear in the revenue productivity of firms, TFPRsi(=PsiAsi), such that 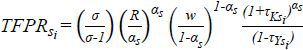 . Thus, TFPR will not differ across firms without distortion, where more resources
will be allocated to firms with higher physical productivity levels to lower their
prices, thus causing the revenue productivity differential to disappear. Therefore,
when
. Thus, TFPR will not differ across firms without distortion, where more resources
will be allocated to firms with higher physical productivity levels to lower their
prices, thus causing the revenue productivity differential to disappear. Therefore,
when  is greater than 1, the firm uses fewer resources than it would without distortions.
The sector TFP is expressed as 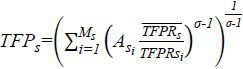 , where
 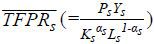 is the geometric average of the average marginal revenue product of capital and labor.6 The physical TFP can be inferred, as
 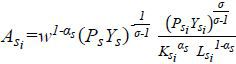 .7 When there is no distortion, the industry TFP becomes As such that
 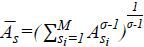 . The potential gain in the sector TFP by removing distortions can be measured as
(As −TFPs) / TFPs. Finally, the potential gain in the industry TFP can be computed by taking the geometric
average of the sectoral TFP gains in the industry weighted by the share of the sector
in the industry output. The TFP gain is considered as a measure of allocation inefficiency.
. The potential gain in the sector TFP by removing distortions can be measured as
(As −TFPs) / TFPs. Finally, the potential gain in the industry TFP can be computed by taking the geometric
average of the sectoral TFP gains in the industry weighted by the share of the sector
in the industry output. The TFP gain is considered as a measure of allocation inefficiency.
To calculate the TFP gains, we use data from the Statistical Survey on Mining and Manufacturing, which is conducted by the Korea National Statistical Office. The survey provides information on the characteristics of manufacturing plants in Korea with more than four workers up to 2006 and with more than nine workers afterwards. In this study, we use data on plants with more than nine workers from the period of 1991-2011.8 Output is defined as value-added output. Labor is defined as the total labor compensation, as in Hsieh and Klenow (2009), to take the quality of the workers into consideration. Capital stock is defined as the book value of the fixed capital stock. The capital stock for every year is calculated by taking the average of the book value of the fixed capital stock at the beginning and end of the year.
We classify sectors in the manufacturing industry using the three-digit ISIC level. To be consistent with the assumptions of the model in the analysis of the effects of resource misallocation on productivity, a more disaggregate level of industrial classification is better, as the model used here assumes that the products manufactured by plants in an identical sector are differentiated but substitutable for each other. Foster, Haltiwanger and Syverson (2008) analyzed sectors such as boxes, bread, coffee, gasoline, plywood and sugar, consistent with the spirit of the basic setting of the model in terms of products made by sectors. Lee, Hwang and Seol (2013) and Ji and Jeong (2015) used the data at the four-digit ISIC level, as in Hsieh and Klenow (2008). This paper uses the data at three-digit ISIC level due to our limited access to finer classifications of the manufacturing subsectors. Because this study attempts to calculate the evolutions of TFP gains of sectors in the manufacturing industry, consistency of the industry classification is important. However, aligning industrial classifications at a more disaggregate level is difficult with the data used here.
In this sense, our estimate may overestimate the effects of resource misallocation compared to other studies with more disaggregated levels of classification. However, the analysis at the four-digit ISIC level is still not immune to a similar problem unless we apply the model to a very fine product level of classification.9 Thus, the indicators of distortion estimated here include not only the effects of distortion on resource allocation in the market but also the effects of unavoidable plant-level heterogeneity caused by intrinsic functional differences in production levels.10 Thus, the potential gains estimated here may include those stemming from intra-sector shifts of resources from subsectors with different levels of TFP relative to the marginal productivity of the resources.
Considering that the industry classification system changed in 1998 and 2007, we aligned
the industrial classification to be consistent across periods with a different classification
system.11 In addition, we removed outlier plants by trimming 1% of  and
and  across industries and set σ to 3 and R to 0.1, as in Hsieh and Klenow (2009).
We estimate the sector capital income share, αs by subtracting the labor income share from 1, where the labor income share is computed by dividing labor compensation by total value-added, as in Lee, Hwang and Seol (2013). Ji and Jeong (2015) used the capital income share of the U.S. manufacturing industry following the method of Hsieh and Klenow (2009). They applied the capital income share of the U.S. manufacturing industry to India and China by assuming that the U.S. production structure is less distorted. It appears too restrictive to assume the functional specification of production to be identical across countries. As the theory of appropriate technology implies, production technology may differ depending on the relative scarcity of factors in the country and technological level of the sectors.
Figure 1 shows the potential TFP gains 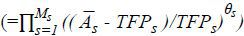 from the hypothetical efficient allocation. It was approximately 10 % in the early
1990s and stayed at a similar level until 1997. It then rose sharply to 18 % between
1998 and 2000, when Korea suffered a deep recession due to the economic crisis, after
which it went down as the Korean economy recovered from the crisis, and then rose
to 24% in 2008. The fluctuation in the TFP gains is not surprising, as these values
are sensitive to the business cycle due to the intrinsic rigidity of resource reallocation.
from the hypothetical efficient allocation. It was approximately 10 % in the early
1990s and stayed at a similar level until 1997. It then rose sharply to 18 % between
1998 and 2000, when Korea suffered a deep recession due to the economic crisis, after
which it went down as the Korean economy recovered from the crisis, and then rose
to 24% in 2008. The fluctuation in the TFP gains is not surprising, as these values
are sensitive to the business cycle due to the intrinsic rigidity of resource reallocation.
FIGURE 1.
POTENTIAL TFPGAINS IN THE KOREANMANUFACTURING INDUSTRY FOR 1991-2011
Note: The TFP gain in 2010 is not calculated because the raw data are not available for 2010 because the 2010 Total Survey on Establishments, which surveyed the manufacturing industry, did not provide all of the variables needed to compute the TFP gain.
The TFP gains calculated here are somewhat comparable to those of Lee, Hwang and Seol (2013) who reported that the TFP gains in 1992 and 2008 were 7.6% and 25.3%, respectively. These TFP gains are much lower than those in Ji and Jeong (2015), who used the industry capital income share of the U.S. manufacturing industry. They reported that the TFP gains in Korea were 50.1% until the early 2000s and that they increased to 73% in 2012. From this, we know that this measure is quite sensitive to how we measure the industry capital income share and that Hsieh and Klenow (2009) may have overestimated the TFP gains or the degree of resource misallocation of India and China. However, the trend of TFP gains in Ji and Jeong (2015) does not differ greatly from ours. We can therefore conclude that the allocation efficiency in the Korean manufacturing industry has been deteriorating since the 1990s given our comparison of the TFP gains in the 2000s with those in the 1990s.
Ji and Jeong (2015) simulated TFP gains over time with and without the top 10% tail of  and found that when we remove the top 10% tail, the TFP gains did not change much
over time. They suggested the underproduction of the top 10% productive plants as
the major cause of the rise in the TFP gains. They noted the difficult degrees of
credit access among young startup firms, the rising market concentration, and the
survival of marginal firms which hold excessive resources relative their productivity
as plausible factors behind the deterioration of resource allocation.
and found that when we remove the top 10% tail, the TFP gains did not change much
over time. They suggested the underproduction of the top 10% productive plants as
the major cause of the rise in the TFP gains. They noted the difficult degrees of
credit access among young startup firms, the rising market concentration, and the
survival of marginal firms which hold excessive resources relative their productivity
as plausible factors behind the deterioration of resource allocation.
At this point, we examine the TFP gains of sectors in the Korean manufacturing industry. Because we have more than 50 sectors, we present here industries at a more aggregate level. Figure 2 shows the TFP gains of the light and heavy industries. The TFP gains of both industries show a rising trend over the examined period. The TFP gains of light industries fluctuate more than those of heavy industries. Because the share of heavy industries is much higher than that of light industries, the sharp rise in allocation inefficiency since 2003 was driven by the heavy industry sector.
FIGURE 2.
POTENTIAL TFPGAINS OF LIGHT AND HEAVY INDUSTRIES
Note: The TFP gain in 2010 is not calculated because the raw data are not available for 2010. The industrial classification is presented in the appendix.
Next, we divide the sectors into four groups according to their technology level based on Hatzichronglue (1997), who classified industries based on the level of R&D intensity. Figure 3 shows the TFP gains of industries with different technology levels. Compared with other groups, the high-tech industry shows the steepest rise in the TFP gain; particularly, the sharp rise in the aggregate TFP gain since 2003 appears to have been driven by the rising TFP gains in the high-tech industry.
FIGURE 3.
POTENTIAL TFPGAINSACCORDING TO THE LEVEL OF TECHNOLOGY
Note: The TFP gain in 2010 is not calculated because the raw data are not available for 2010. The technology level is based on Hatzichronglue (1997). The industrial classification is presented in the appendix.
Finally, we calculate the TFP gains of different groups of plants based on Pavitt’s (1984) taxonomy of innovation modes. In it, firms are categorized according to the sources of technology; the degree of user dependence on innovation; and the appropriation of innovation, such as supplier-dominated, scale-intensive, specialized suppliers, and science-based industries. The innovation mode of industries could bring about different inter-sectoral linkages rather than intra-sectoral linkages. However, the innovation mode usually influences the size distribution of sectors and may serve to differentiate between resource-allocation mechanisms. According to Figure 4, the TFP gains of science-based industries rose sharply starting in 2003, as did those of high-tech industries. This was driven by the rapidly rising TFP gains of the sectors in the electronics industry. The supplier-dominated industry, whose sectors overlap with those of light industries, shows a TFP gain trend similar to that in the light industries. The specialized suppliers industry, which includes machinery, shows a steadily rising trend over time.
FIGURE 4.
POTENTIAL TFPGAINSACCORDING TO THE INNOVATION MODE
Note: The TFP gain in 2010 is not calculated because the raw data are not available for 2010. The classification of industries by innovation mode is based on Pavitt (1997). The industrial classification is presented in the appendix.
From the previous figures pertaining to the trends in TFP gains across different industry groups, we note that the trends in TFP gains differ greatly across industries. We would see a greater variety of patterns of TFP gains, which are considered as indicators of allocation inefficiency across sectors. If we strictly follow the interpretation of the TFP gains from the model as an indicator of allocation inefficiency, the question arises of how the distortions from the size-dependent policies such as special tax treatments or public subsidies to SMEs could result in such different patterns across industries. However, if we examine the heterogeneous industrial dynamics across sectors, the different patterns of the evolution of measured allocation inefficiency are not surprising, as different sectors are exposed to different types of shocks at different times, and allocation inefficiency measured in this way could be temporarily affected by the rigidity of resource reallocation in response to these shocks. Thus, we may ask whether the long-term rise in the TFP gains truly reveals rising allocation inefficiency in the Korean manufacturing industry. To assess this, we investigate long-term productivity trends in the Korean manufacturing industry.
III. Patterns of Productivity Dispersion
In the previous section, we found that the potential TFP gains in Korea are quite different across sectors in the manufacturing industry. In this section, we examine the productivity dispersions of sectors and suggest that they are closely related to the TFP gains.
Figure 5 shows the evolution of the Theil index of labor productivity dispersion of the Korean manufacturing industry for 1980-2011. The dispersion of labor productivity declined until the mid-1990s, though it has steadily increased since 2003. In the short term, it is sensitive to the business cycle and thus rises during recessions. Figure 5 also compares the productivity dispersion of light and heavy industries. The long-term trends for the labor productivity dispersion are similar between light and heavy industries, showing a U-shaped pattern starting in the 1980s. However, the productivity dispersion for light industries has been relatively high, sharply increasing in the 2000s.12 Figure 6 shows the productivity dispersions according to the technology level of industries. The patterns of dispersion over time are quite different across industries with different technological levels. The dispersion in high-technology industries rose in the mid-1990s and remained high. It also showed significant fluctuation in the 2000s. The dispersion in low-tech industries shows a pattern similar to that of high-tech industries. In contrast, the dispersion of what are termed here ‘mid-tech’ industries did not change much, although it shows a rising trend over time. As a result, the differences in dispersion among groups at different technological levels in the 2000s were compared with those in the previous decades. Figure 7 shows the productivity dispersions of different groups of plants based on Pavitt’s (1984) taxonomy of innovation modes. All show a U-shaped trend in the productivity dispersion. However, the dispersion of specialized suppliers remained low throughout these periods. It is notable the dispersion of scale-intensive industries declined sharply in the 1980s.
FIGURE 5.
LABOR PRODUCTIVITY DISPERSION FOR 1980-2011
Note: Theil index of value-added per worker. The classification of industries is presented in the appendix.
FIGURE 6.
LABOR PRODUCTIVITY DISPERSION ACCORDING TO THE TECHNOLOGICAL LEVEL OF THE INDUSTRY
Note: Theil index of value-added per worker. The technology levels of industries are based on Hatzichronglue (1997). The classification of industries is presented in the appendix
FIGURE 7.
LABOR PRODUCTIVITY DISPERSION ACCORDING TO THE INNOVATION MODE
Note: Theil index of value-added per worker. The classification of industries is based on Pavitt (1984) and is presented in the appendix
In sum, the labor productivity dispersions are quite different across industries, although the overall trend for labor productivity shows a U-shaped pattern, declining in the 1980s and rising in the 2000s. Here, we add Figure 8, which shows the productivity dispersion according to the plant size. The result shows quite different patterns across groups of plants of different sizes. The productivity dispersion of large plants with more than 1000 workers has been highest since the 1990s, although it dropped sharply during the 1980s. The dispersion of plants with 300-999 workers also declined sharply until the early 1990s, following the pattern in larger plants but with a time lag. This may be due to the scaling down of firms in light industries and the increasing outward direct investment in these industries during that time.13 The dispersion of plants with 100-299 rose sharply with the economic crisis in 1997 and remained high afterwards. Smaller plants show relatively smooth patterns of dispersion over time at lower levels of dispersion. The dispersion of small plants with 10-49 workers has been lowest compared to those of the larger plants, remaining at this level without much change over the period until the mid-2000s.
FIGURE 8.
LABOR PRODUCTIVITY DISPERSION BY PLANT SIZE
Note: Theil index of value-added per worker. The size of the plants is defined as the number of workers in the plants.
What drives the long-term evolution of labor productivity dispersion? We decompose
the dispersion of labor productivity into the dispersions of TFP and capital intensity
while assuming the Cobb-Douglas production function such that 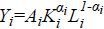 , where αi is the capital income share, which is 1 minus the labor income share of plant i.
Figure 9, Figure 10, and Figure 11 show the capital intensity dispersions. First, the capital intensity dispersion is
higher than the labor productivity dispersion. It declined in the 1980s, rose during
the economic crisis in the late 1990s, and declined steadily afterwards. Given that
the number of plants in the heavy industries is much greater than that in the light
industries, the overall dispersion of the capital intensity is similar to that in
the heavy industries. The capital intensity dispersion in light industries is higher
than in heavy industries. Second, as the labor productivity dispersion, the patterns
of the capital intensity dispersion are also different across industries. Overall,
the capital intensity dispersions did not increase much in the 2000s.
, where αi is the capital income share, which is 1 minus the labor income share of plant i.
Figure 9, Figure 10, and Figure 11 show the capital intensity dispersions. First, the capital intensity dispersion is
higher than the labor productivity dispersion. It declined in the 1980s, rose during
the economic crisis in the late 1990s, and declined steadily afterwards. Given that
the number of plants in the heavy industries is much greater than that in the light
industries, the overall dispersion of the capital intensity is similar to that in
the heavy industries. The capital intensity dispersion in light industries is higher
than in heavy industries. Second, as the labor productivity dispersion, the patterns
of the capital intensity dispersion are also different across industries. Overall,
the capital intensity dispersions did not increase much in the 2000s.
FIGURE 9.
CAPITAL INTENSITY DISPERSION FOR 1980-2011
Note: Theil index of capital per worker. Industry classification is presented in the appendix.
FIGURE 10.
CAPITAL INTENSITY DISPERSION ACCORDING TO THE LEVEL OF TECHNOLOGY
Note: Theil index of capital per worker. Industry classification is presented in the appendix.
FIGURE 11.
CAPITAL INTENSITY DISPERSION ACCORDING TO THE INNOVATION MODE
Note: Theil index of capital per worker. Industry classification is presented in the appendix.
Figure 12, Figure 13, and Figure 14 show the TFP dispersions. First, the TFP dispersion of the manufacturing industry shows a clearly rising trend in the 2000s compared to the dispersions of labor productivity and capital intensity. As a result, it shows a U-shaped trend starting in the 1980s. Second, the trends of the TFP dispersion are quite different across industries. The rising trend of the TFP dispersion in the Korean manufacturing industry was driven by the rapidly rising TFP dispersion of the high-tech and low-tech industries. It is noteworthy that the rise in the TFP gains in the previous section was driven by high-tech industries in the 2000s.
FIGURE 12.
TFPDISPERSION
Note: Theil index of TFP. Industry classification is presented in the appendix.
FIGURE 13.
TFP DISPERSION ACCORDING TO THE LEVEL OF TECHNOLOGY
Note: Theil index of TFP. Industry classification is presented in the appendix.
FIGURE 14.
TFP DISPERSION BY INNOVATION MODE
Note: Theil index of TFP. Industry classification is presented in the appendix.
From the exploration of the productivity dispersions in the Korean manufacturing industry, we find that the productivity dispersions across industries display quite different patterns in their long-term trends, although the overall trend of the productivity dispersions shows a U-shaped pattern, declining in the 1980s and rising in the 2000s. In terms of appearance, the long-term trend of the labor productivity dispersion appears to have been driven by the TFP dispersion. The capital intensity dispersions show considerable changes over time, although the capital intensity is more dispersed. Thus, we surmise that the rising TFP gains in the 2000s may be related to the rising TFP dispersions given the similarity in their long-term trends.
IV. Explaining the Rising TFP Gains in the Korean Manufacturing Industry
In this section, we attempt empirically to examine the rising TFP gains by investigating their correlations with the TFP dispersions and factors of allocation distortion. Because we calculate both output and capital distortion (τKsi and τYsi) for each plant, it will be ideal to investigate the relationship between these calculated distortion factors of individual plants and variables related to each plant’s tax rates, subsidies, degree of credit access, access to cheap credit, labor rigidity and other factors. However, we do not have plant-level data related to these factors. In addition, because we cannot identify the plants in the raw data, we cannot trace the changes in the distortion factors over time at the plant level. Therefore, we attempt to explain the variations in the TFP gains across sectors by correlating the TFP gains of the sectors with proxies which characterize the factors causing the resource misallocations of sectors.
First, we examine the relationship between the TFP gains and the TFP dispersions across sectors. We estimate from the figures in the previous section that the TFP gains would be positively correlated with the TFP dispersions. Table 1 shows the empirical results of the correlation between the TFP gains and the TFP dispersions. We run an OLS regression by pooling data for the period of 1991-2011 (excluding 2010, when the data are not available) without fixed effects and with sector-specific fixed effects, period-specific fixed effects and both fixed effects in the regression. We find there is a significant correlation between the TFP gains and TFP dispersions. The explanatory power of the TFP dispersion is higher with sector-specific fixed effects than with period-specific fixed effects, implying that the TFP dispersion explains the variations in the TFP gains across periods better than the variations in the TFP gains across sectors. That is, there is a significant difference across sectors other than those explained by the different TFP dispersions across sectors. This may be due to the significantly sharp rise in the TFP gains regardless of the sector when the economy experienced the economic crisis of 1997.
TABLE 1
TFP GAINS
Note: ***, ** and * indicate statistical significance at the 1%, 5% and 10% level, respectively. The TFP dispersion is measured by the Theil index.
Next, we examine the relationship between the TFP gains and the proxies for the distortions suggested in the literature. It is not easy to find adequate proxies for distortion factors. First, following Meritz (2003), who showed that export exposure reduces resource misallocation, we examined whether sectoral exports are related to TFP gains. Because we do not have the export data of plants in the raw data, we instead compute the ratio of exports to the gross output of the sectors in the I-O table.14 We expect a negative correlation.15 Secondly, we choose the concentration ratio (the share of the top three plants in terms of sectoral output), which may affect TFP gains. We expect a positive correlation under the assumption that a concentrated market with less competition is less efficient. Third, we consider the average age of the plants. We expect a positive correlation between the ages of plants and allocation inefficiency. Sectors with a younger age on average would be more active in terms of the entry and exit of plants and may be more efficient with regard to resource allocation. Fourth, we examine the correlation between the average size of the plants (computed as the number of workers divided by number of plants in the sector) and the TFP gains. After the economic crisis of 1997, the number of plants increased while the number of workers decreased.16 As a result, the sizes of plants in some sectors decreased. According to Guner, Ventura and Xu (2008), a reduction in the plant size may have a negative effect on resource allocation, as size-dependent policy distortions reduce the sizes of plants. Finally, we include the ratio of white collar workers in total employment following Bartelsman, Haltiwanger and Scarpetta (2013), who emphasized the relationship between overhead labor and distortions. The existence of considerable overhead labor acts as a source of friction, which prevents firms from adjusting resource allocation to become efficient in response to productivity changes. We expect that a larger ratio of white collar workers will lead to more inefficiency in the resource allocation (i.e., higher TFP gains).17 We computed the ratio of white collar workers using data obtained from the Basic Survey of Wage Structure conducted by the Ministry of Labor.18
To examine the correlation between the factors of distortions and the TFP gains empirically, we compute the average of the variables for the periods of 1992-1997 and 2002-2007 while excluding years which may be affected by sharp recessions during an economic crisis and run the regression with fixed effects by pooling the data.19 Table 2 shows the correlation between the plausible determinants of resource inefficiency and TFP gains. The export ratio and the concentration ratio are not significant. The plant size, age and white collar ratio are significant. The sign of the correlation between the plant size and the TFP gains is positive, whereas we expected a negative sign from the theory. The correlation between plant age and TFP gains is not negative, as we expected. The sign of the white collar ratio is consistent with the theory. However, when we run the regressions with these variables while including the TFP dispersion, as shown in column (7), only the TFP dispersion is significant.20 This finding implies that the variations in the TFP gains across sectors are mainly explained by the variations of the TFP dispersion in the sectors.
TABLE 2
DETERMINANTS OF THE TFP GAINS
Note: ***, ** and * indicate statistical significance at the 1%, 5% and 10% level, respectively. Age is the log of the average age of plants. Size is the log of the average number of workers per plant. The empirical results are from regressions with sector-specific fixed effects.
From Table 1 and Table 2, we note that the rising TFP gains could be better explained by the rising TFP dispersions than by the deterioration of resource allocation, as implied in the model devised by Hsieh and Klenow (2009). Therefore, we should know why the TFP dispersion increased in the 2000s compared to the 1990s to understand the rising potential TFP gains as measured by the model. The increase in the TFP dispersion indicates that the TFP became more differentiated across the plants in the sector. Because we cannot identify the individual plants, it is not easy to distinguish whether the rising TFP dispersion comes from the increasing heterogeneity of TFP shocks to the plants or from the widening TFP gap across the plants over time. If the rising TFP dispersion comes from the rising heterogeneity of shocks, the rising TFP dispersion itself cannot be interpreted as a symptom of resource misallocation. In this case, it reflects the unavoidable rigidity of the plant’s resource reallocation in response to temporal TFP shocks. This can differ across sectors and even across plants within sectors depending on the characteristics of the technology and the production process. It is not related to the price distortions faced by a firm. For instance, plants in scale-intensive industries may not easily adjust their capital-output ratios in the short run.
TFP gains measured based on Hsieh and Klenow (2009) could be interpreted as an indicator of allocation inefficiency if the TFP dispersions do not change much over time. If the TFP gains increase even with an unchanged TFP dispersion, we may interpret the rising TFP gains as an indicator of falling efficiency. However, like the Korean manufacturing industry, in which TFP dispersions change greatly, we cannot conclude that the resource allocation became less efficient simply by looking at the rising TFP gains measured by the model. The rising TFP dispersion could be related to structural changes in the production process, including outsourcing and offshoring. For instance, plants could procure intermediate goods in different ways, from domestic producers or foreign producers, and they may also outsource production to other firms through subcontracting in the global production network. With changing networks of production, different plants could face different prices and use different technologies depending on the production network to which they belong. In the long run, the production process tends to become similar across plants if the plants catch up with most efficient firms in networking the production. In Table 3, we examine the correlation between TFP dispersions and outward direct investments of the sectors. The data on outward direct investments were obtained from the internet database of the Korea Export-Import Bank. We find that there is a significant correlation. We also include dummy variables for the technology level and innovation mode of industries, but they are not significant, although this result reflects the relatively large TFP dispersion in low-tech and supplier-dominated industries, such as textiles.
TABLE 3
DETERMINANTS OF TFP DISPERSIONS
Note: ***, ** and * indicate statistical significance at the 1%, 5% and 10% level, respectively. Tech1, Tech2, Tech3 and Tech4 are low-tech, mid-low tech, mid-high tech and high-tech industry dummies, respectively. PAV1, PAV2, PAV3 and PAV4 are supplier-dominated, scale-intensive, specialized-supplier and science-based industry dummies, respectively. ODI is the log of outward direct investments. We allowed sector-specific random effects in the regressions with dummy variables for technology level and the innovation mode of the industry.
Because this is a simple regression, we cannot tell how outward direct investments increase the TFP dispersion specifically. However, the findings show that aspects of sectoral dynamism in production, such as outward direct investments, may instigate more dispersion in the TFP across plants depending on their positions related to changing situations, such as a rising global production network. A comprehensive study is needed to investigate the rising TFP dispersion, which could be an interesting subject for future study.
V. Conclusion
In this study, we calculate the potential TFP gains for the Korean manufacturing industry following Hsieh and Klenow (2009), who suggested TFP gains as an indicator of resource misallocation. According to this measure, the allocation efficiency of Korea was worse in the 2000s than it was in the 1990s, similar to the findings of other studies using the same methodology. We compared the patterns of the calculated TFP gains for sectors in the manufacturing industry and those of the TFP dispersions and found that there is clear similarity between the two.
We examined the correlation between the calculated TFP gains and the TFP dispersions (the Theil index of the TFP) using panel regressions and found that there is significant correlation between the two variables. We also investigated the correlation between the TFP gains and proxies for distortion factors. The empirical results indicate that the variations of the TFP gain across sectors could be explained by the variations in the TFP dispersion rather than variations in distortion factors. Therefore, we can conclude that the rising TFP gains calculated based on the macroeconomic model linking allocation inefficiency and aggregate TFP do not necessarily imply deteriorating allocation efficiency, at least in case of the Korean manufacturing industry. The Korean manufacturing industry underwent a drastic transformation starting in the mid-1990s, and the dynamics of sectors in terms of technology and production processers such as outsourcing and offshoring may have led to an increase in the dispersion of TFP across the plants within sector. Therefore, we should investigate the causes of the rising TFP dispersions rather than the effects of distortion factors to understand the rising TFP gains calculated by the model of Hsieh and Klenow (2009).
This model suggests an easy-to-apply methodology with a good theoretical background, but one should be concerned with where to apply the model. To be consistent with the theoretical grounds of the model, one should use industries which produce products that are roughly homogeneous with small quality variation, as in Foster, Haltiwanger and Syverson (2008) and Banerjee and Munshi (2004). With disaggregation at the three-digit or four-digit ISIC, which includes various plants which produce highly differentiated products with quite different processes and technologies, the TFP gains measured as an indicator of allocation inefficiency include not only market distortions but also many other factors which may affect the TFP of plants. In this respect, we need further evidence before concluding that the Korean manufacturing industry became more inefficient in terms of resource allocation based on the calculated TFP gains. Given that the Korean manufacturing industry repositioned itself by actively expanding its outsourcing efforts through a global production network, it is necessary to take into account the dynamics of the industry when interpreting the measures of resource misallocation.
Notes
Output distortion distorts output prices while capital distortion distorts the rental price of capital.
Following the presentation of the methodology is an exact reproduction of Hsieh and Klenow (2009).
The model assumes that each firm has a single plant which produces a single differentiated product.
 .
.
 is not observable but is constant across firms. Thus, relative productivities are
not affected by setting this term to 1.
is not observable but is constant across firms. Thus, relative productivities are
not affected by setting this term to 1.
Raw data for the survey are available starting in 1980. However, the quality of the data in the survey in the 1980s is not as good given the relatively small number of plants.
The number of sectors at the three-digit level is close to 60, while there are approximately 170 at the fourdigit level. To be strict given the basic assumptions of the model, further disaggregation is necessary.
A functional difference may exist even with the product-level classification because the functional form of production is very simple given that factors such as managerial input and other are omitted.
There may be many reasons for the differences in productivity across sectors and industries. It is beyond the scope of this paper to investigate these, however. Here, we focus on the various productivity trends across sectors and across specified groups of plants.
If we remove textiles and apparel from the sample, the dispersions of larger plants are similar to those of the other groups.
We use the I-O table for 1995 and 2005 and we use export-output ratios in 1995 and 2005 in the regression.
The average size of the plants in manufacturing industry decreased from 48.4 workers in the 1990s (the average of 1992-1997) to 39.9 workers in the 2000s (average of 2002-2007) according to the Survey. The changes in the sizes of plants are quite different across sectors.
There could be other distortion factors to consider. For example, following Rajan and Zingales (199), Hosono and Takizawa (2012) tested whether external finance dependence is related to the distortion factor calculated based on the methodology of Hsieh and Klenow (2009). However, we cannot include this factor due to data limitations.
The data are available starting in 1993. Thus, we use the averages for 1993-1997 and for 2002-2007 in the regression.
We also run the regression by pooling data for 1991-2011 and find that size and CR3 are significant but that age is not significant. The sign of CR3 is positive, as expected, but that of size is positive. Moreover, the Theil index of TFP dominates over the other variables when we run the regression together.
References
, & (2004). How Efficiently is Capital Allocated? Evidence from the Knitted Garment Industry in Tirupur. Review of Economic Studies, 71, 19-42, https://doi.org/10.1111/0034-6527.00274.
, , & (2013). Cross-country Differences in Productivity: The Role of Allocation and Selection. American Economic Review, 103(1), 305-334, https://doi.org/10.1257/aer.103.1.305.
, , & (2008). Selection on Productivity or Productivity? American Economic Review, 98(1), 394-425, https://doi.org/10.1257/aer.98.1.394.
, , & (2008). Macroeconomic Implications of Size-dependent Policies. Review of Economic Dynamics, 11(4), 721-744, https://doi.org/10.1016/j.red.2008.01.005.
, & (2009). Misallocation and Manufacturing TFP in China and India. Quarterly Journal of Economics, 124(4), 1403-1448, https://doi.org/10.1162/qjec.2009.124.4.1403.
(2003). The Impact of Trade on Aggregate Industry Productivity and Intra-industry Reallocations. Econometrica, 71(6), 1695-1725, https://doi.org/10.1111/1468-0262.00467.
, & (2008). Policy Distortions and Aggregate Productivity with Heterogeneous Establishments. Review of Economic Dynamics, 11(4), 707-720, https://doi.org/10.1016/j.red.2008.05.002.