
Financial Integration in East Asia: Evidence from Stock Prices
Abstract
This paper investigates the extent of global and regional integration in East Asia using stock price index as a measure of economic performance. We employ a structural VAR model to separate the underlying shocks into “global”, “regional” and “country-specific” shocks. The estimation results show that country-specific shocks still play a dominant role in East Asia although their role appears to have declined over time, especially after the 1997 financial crisis. Global and regional shocks are responsible for small but increasing shares of stock price fluctuations in all countries. The results indicate that the stock markets in East Asia remain dissimilar and are subject to asymmetric shocks in comparison to European countries.
Keywords
Financial Integration, East Asia, Europe, Structural VAR Model, 금융통합, 동아시아, 유럽, 구조적 VAR 모형
JEL Code
G0, N2
Ⅰ. Introduction
The 1997-8 financial crises in East Asia have had far-reaching repercussions in the real economy, policy making, and academia. Within the region, countries have started showing a strong interest in the search of an exchange rate regime that would be more robust to financial crises. At the same time, East Asian nations have been working in earnest for regional economic integration in the past decades. To enhance the financing facilities in the aftermath of the financial crisis, the Chiang Mai Initiative was launched by 10 member countries of the Association of Southeast Asian Nations (ASEAN) plus China, Japan, and Korea (ASEAN+3) in May 2000.1 In order to facilitate the channel for better utilization of Asian savings for Asian investments and enhance efficiency and liquidity in bond markets in Asia, a local currency-denominated bond market under the Asian Bond Markets Initiative has been developed.2 In 2005, the East Asia Summit was established by ASEAN+3 plus Australia, New Zealand and India, for the total of 16 countries.
As an important element of financial integration, East Asian countries have been seeking the feasibility of an economic and monetary union. Key policymakers are increasingly vocal about the need to establish a monetary union in the region or create a single currency. Earlier attempt by Japan to create a monetary union died quickly due to strong oppositions from the IMF and the US Treasury. Inspired by the European Currency Unit, now replaced by the Euro, the Asian Development Bank has proposed the Asian Currency Unit (ACU) – a weighted index of currencies for ASEAN+3. Despite numerous technical and political obstacles, the ACU has been moving forward from an academic exercise to a real outcome, one that can be used in the market amid a growing consensus among academic and policy practitioners that intraregional exchange rate stability is desirable for East Asia and a monetary union is the ultimate form to ensure it.3
One natural question is whether East Asian countries are well integrated financially in a global sense. Are they also regionally well integrated as they have tried to achieve in the aftermath of financial crises? These are important questions since regional integration may reduce the cost of forming a currency union or some form of common-currency pegging within the region. Individual member countries will lose the ability to independently use monetary and exchange rate policy when they form a currency union, which may entail severe costs if they are subject to dissimilar macroeconomic shocks and go through different business cycles. If countries within the region are similar to each other, the cost from losing the independent monetary and exchange rate policy would be lower. Trade and financial integration of an individual economy with the region is likely to reduce the cost of such a common currency arrangement to the extent that it makes the economy more similar to that of the region.
It is well known that East Asian economies are well integrated in terms of intraregional trade. For instance, Bayoumi and Eichengreen (1994) suggest that, in terms of trade integration, East Asia can qualify optimum currency area (OCA) criteria as well as European countries. Evidence on financial market integration, however, is much less clear. The majority of studies claim that the degree of financial market linkage in East Asia still remains low compared to Europe. Using data on cross-border bilateral holdings of financial assets and liabilities, real interest rate differentials, and consumption risk sharing, Jeon et al (2005) show that East Asian economies became more financial integrated in the post-crisis period. The development is more in the direction of global integration than in regional integration. With similar and additional data such as equity portfolios, debt securities, and bank claims, Kim et al (2008) reach a similar conclusion that East Asian countries are financially less integrated in general than European countries. They also estimate the degree of consumption risk sharing in East Asia by regression analysis and tend to be relatively more linked to the global markets than integrated with one another regionally, particularly compared to Europe.
The purpose of this paper is to assess the extent of financial integration within East Asia and study whether countries in the region satisfy the conditions for an OCA. We employ the overall stock price index as an indicator of macroeconomic performance as well as the development of financial market in each country. The availability of high-frequency data is also a big advantage in our case where the sample period is short due to general data problems of developing countries and made even shorter as a result of the recent financial crisis and resulting structural breaks.
We use a structural vector autoregressive (VAR) method to investigate the extent of financial market integration in East Asia. Returns to investors in each country’s market are affected by three types of underlying shocks: country-specific shocks, regional shocks and global shocks. These structural shocks are identified by long-run restrictions developed by Blanchard and Quah (1979). To investigate the progress in financial integration, we also separate the sample into 8 non-overlapping 2-year subperiods before and after the crisis. We then compare the East Asian region with that of 15 European countries. The experiences of the Economic and Monetary Union (EMU) provide a natural benchmark as the member countries have followed the rigorous process of regional integration in trade and finance and successfully formed a monetary union.
The empirical results show that, in all East Asian stock markets, country-specific shocks are dominant although they became less important in the post-crisis period than in the pre-crisis period.4 Regional shocks play a minimal role in most cases while the importance of global shocks varies across countries depending on the extent of financial openness and development. In European countries, in marked contrast, external shocks that combine both global and regional shocks appear to take over the dominant position. This suggests that, despite years of efforts toward financial liberalization and cooperation in the region, the East Asian economies are subject to asymmetric shocks and far less integrated financially compared to the European countries. The region seems sufficiently unique perhaps due to different resource endowments, growth experience or economic policies although the efforts for financial integration in the post-crisis period appear to have some effects on the economic and financial structure in the region. Theory of optimum currency area would predict that pegging to the same currency would be more costly in East Asia than it would be in European countries.
The rest of the paper is organized as follows. Section II reviews the current status of trade and financial integration in East Asia. Section III illustrates the data and methodology used in our empirical analyses. Section IV examines the degrees and patterns of regional shocks and country-specific shocks on domestic stock market by using forecast error variance decomposition. Section V investigates the robustness of the benchmark model. Section VI provides concluding remarks.
Ⅱ. Economic Integration in East Asia
1. Trade Integration in East Asia
The extent of regional integration through trade in East Asia has been rising fast over the last twenty years. Wyplosz (2001) uses a gravity approach to determine a “normal level” of bilateral trade among Asian and European economies and finds that East Asia is more, while Europe is less, integrated than one would expect. According to the theory of OCA, a high degree of intraregional trade can increase the efficiency gain of using a common currency while lowering the cost of losing monetary policy autonomy. There is some evidence that joining a currency union can increase trade among member countries, which will further strengthen the case for the formation of the currency union.5
Table 1 summarizes the changes in the share of intraregional trade for various regions in the world over the period of 1980-2006.6 For comparison, the fourth panel of the table lists the trade pattern for the Euro area within the region and with the outside world. It shows that the intraregional trade in the Euro area is stable and maintained at around 65 percent.
<Table 1>
Regional Trade Patterns (Percentage of Total Exports/Imports with the World)
Note: 1) ASEAN: Brunei, Cambodia, Indonesia, Laos, Malaysia, Myanmar, Philippines, Singapore, Thailand, Vietnam
2) East Asia: ASEAN plus Japan, China, P.R.: mainland, China, P.R.: Hong Kong, Korea
3) East Asia and Pacific Area : East Asia plus Australia, New Zealand
4) Euro Area: Austria, Belgium, Finland, France, Germany, Greece, Ireland, Italy, Luxembourg, Netherlands, Portugal Spain.
Source: IMF Direction of Trade Statistics, World Development Indicators June 2007
The first panel reports trade patterns in the ASEAN. Intraregional trade within the ASEAN increased steadily since 1980 except a slight downturn in exports after 1995, perhaps reflecting the recessionary consequences of the financial crisis that hit the region. The roles of the United States and Japan are still dominant but have declined over the whole period. In addition, there is a significant increase in intraregional trade ratio in a broader region. By adding China, Hong Kong, Japan and Korea to the region in the second panel, we find that nearly half of international trade of the region is with regional partners in 2006. The United States is still the largest importer in East Asian trade, but it is no longer the largest exporter. Trade with the Euro area increased early, peaked in 1990 at 17.9 percent for exports and 15.1 percent for imports. Since then, the trade preference of East Asia with Euro area seems to have declined. Exports to the Euro area dropped to 15.4 percent and imports from Euro area dropped to 10.1 percent in 2006.
In the third panel, Australia and New Zealand are added to East Asia. The intraregional exports and imports have risen dramatically from the 1980s through the 2000s. For instance, in 1980, 37 percent of total import and export were with the regional trading partners. By 2006, the figures rose to 48.6 percent and 51.9 percent, respectively. The table demonstrates, however, that the intraregional trade ratios among East Asian economies are still lower than those of the Euro area by more than 10 percent in 2006.
2. Financial integration in East Asia - the Chiang Mai Initiative
Before the Asian financial crisis broke out in 1997, few would have seriously argued for the creation of a new regional financial cooperation system. Economic integration in the region had been mostly a market-led process. One of the most noteworthy outcomes of the financial crisis would be the initiation of regional financial cooperation by the East Asian economies. The financial crisis gave East Asia a strong impetus to search for a regional mechanism that could forestall future crisis. Japanese financial authorities proposed the creation of an Asian Monetary Fund (AMF) as a framework for promoting financial cooperation and policy coordination in the region at the G7-IMF meetings in Hong Kong during September 20-25, 1997.7 The United States, European Union and the IMF opposed the proposition on grounds of moral hazard and duplication. In November 1997 the East Asian economies, together with the United States, Canada, Australia and New Zealand, agreed to establish the Manila Framework Group in order to develop a concerted approach to restoring financial stability in the East Asia. The Manila Framework took an initiative to create a mechanism for regional surveillance complimentary to the global surveillance by the IMF.8
In October 1998, Japan pledged $30 billion to support the economic recovery of the crisis-affected countries. The initiative provided major assistance for restructuring corporate debt, reforming financial sectors, strengthening social safety nets, generating employment and addressing the credit crunch. The initiative was called “New Miyazawa Initiative” and was highly successful.9 In November 1998, the United States and Japan jointly announced the Asia Growth and Recovery Initiative (AGRI), which was a multilateral effort to stimulate economic growth in Asia. With support from the World Bank and the Asian Development Bank (ADB), AGRI supported corporate restructuring and restored market to private capital. It also strengthened bond guarantee functions of the World Bank and the ADB.
The idea of an AMF was revived when the finance ministers of China, Japan and South Korea, along with the ten ASEAN members, agreed on May 6th, 2000 in Chiang Mai, Thailand to establish a system of swap arrangements within the group. The regional scheme for financial cooperation known as the Chiang Mai Initiative (CMI) has been gathering momentum and opening the doors to possibly significant policy-led integration in East Asia. The CMI has two components: expanded ASEAN Swap Arrangements (ASA) encompassing the ten ASEAN countries; and a network of Bilateral Swap Arrangements (BSA) repurchasing arrangements basically encompassing the thirteen ASEAN + 3 countries.
At present, the total amount of BSAs covering all 13 countries is estimated to be around $83 billion.10 The maximum amount that any individual country can draw varies a great deal. For instance, the maximum liquidity through the CMI to Thailand is about $12 billion while the BSA to Malaysia is $6.5 billion. Doubts have been raised as to whether the BSA system could truly be a credible and effective system of defense against future speculative attacks. The success of the CMI will depend on whether the surveillance system in East Asia can work as effectively as expected. A mechanism that enforces exchange of information and applies peer review and pressure through policy coordination is the right approach to boost the confidence of the countries in the region. It is expected that East Asia will reach deeper monetary and economic integration with gradual development of the CMI to a more effective and efficient regional arrangement.
3. Financial integration in East Asia - Asian Bond Market Initiative
Due to the underdevelopment of capital markets, countries in East Asia have depended on short-term foreign currency-denominated financing. This causes “maturity” and “currency” mismatches which make the region vulnerable to volatility in short-term capital movements. The East Asian financial crisis vividly illustrates the risks of the double mismatches. It has been agreed that developing bond markets in the region would be effective in regional financing as well-functioning bond markets set the benchmark interest rates for all debts with varying maturities and risks and thereby promote efficient uses of resources for economic growth. The Asian Bond Market Initiative (ABMI) aims to develop efficient and liquid bond markets in East Asia, enabling better utilization of regional savings for investment within the region.11 Its activities focus on the following two areas: (1) facilitating access to the market through a wider variety of issuer and types of bonds, and (2) enhancing market infrastructure to foster bond markets in Asia.12 Asian governments, central banks and the Asian Development Bank are keen to see the expansion of Asian bond markets in order to help provide finance for the large infrastructural development that the region needs over the next decade. Alongside the expansion of the bond markets, Asian governments and central banks are currently discussing the creation of an ACU. The ADB has suggested that bonds may also be issued in ACU over the next few years which would help lower the financing costs for Asian issuers who have substantial trade links with other countries in the region.13
4. Stock Markets in East Asia
Stock exchanges in Asia developed much later than those in Europe or America. The first Asian market for securities trading was in Shanghai which began in the late 1860s. The first share list appeared in June 1866. The Bombay Stock Exchange, launched in 1875, was the oldest organized market in the region, followed by the Tokyo Stock Exchange (TSE) three years later. In 1891 during the boom in mining shares, foreign businessmen founded the "Shanghai Sharebrokers' Association" headquartered in Shanghai as China's first stock exchange.
Off to a late start amid dramatic historic events, Asian stock markets were quick to adopt cutting-edge strategies and have experienced rapid growth. They espoused technology, demutualized and listed their own shares long before U.S. markets did. The TSE is the second stock exchange in the world by market value, second only to the New York Stock Exchange. It currently lists 2,271 domestic companies and 31 foreign companies, with a total market capitalization of over 5 trillion dollars. The TSE was established in 1943, the exchange was combined with ten other stock exchanges in major Japanese cities to form a single exchange.
The Shanghai Stock Exchange was reestablished on November 26, 1990. A market capitalization of nearly $2.38 trillion makes it the fifth largest in the world. There are two types of stocks being issued in the Shanghai Stock Exchange: “A” shares and “B” shares. A shares are priced in the local Renminbi yuan currency, while B shares are quoted in U.S. dollars. Initially, trading in A shares is restricted to domestic investors only while B shares are available to both domestic (since 2001) and foreign investors. However, after reforms were implemented in December 2002, foreign investors are now allowed to trade in A shares with some restrictions under the Qualified Foreign Institutional Investor system and there is a plan to eventually merge the two types of shares.
Development of the stock markets in East Asia has been accelerated in the aftermath of the 1997 crisis. Willingly and also upon the International Monetary Fund and other external pressures, East Asian countries have become far more open. Table 2 shows the magnitude of market capitalization in our sample as of the end of 2011. China became the second largest stock market, surpassing Japan. The total size of the 12 East Asian stock markets included in the sample is very close to that of the United States, far exceeding that of the European Union.
<Table 2>
Market value of publicly traded shares(Billion US dollars, 2010:12:31)
Note: % denotes the percentage of the world total. Source: CIA World Factbook
In this paper we employ and focus on the overall stock price index as indicator of the overall performance of the economy. It is well known that stock prices are a good leading indicator of economic activity. Traditional models suggest that the price of a firm’s stock equals the expected present value of the firm’s future payouts or dividends. As long as these expectations reflect the underlying fundamental factors, they must ultimately reflect real economic activity.14
Ⅲ. Data and Methodology
According to the theory of optimum currency areas (OCA), joining a single currency area brings in costs and benefits. The benefits include reductions in uncertainty and transactions costs that can arise under floating exchange rates. The costs are due to the inability to use monetary and exchange rate policy for economic stabilization. The magnitude of the costs is expected to be lower if business cycles in the member countries are closely correlated and their economic structures are similar.
The OCA criteria have been operationalized and quantified in a number of studies. Bayoumi and Eichengreen (1993), in a well-known study, examine the correlation of aggregate supply shocks to investigate the similarity of economic structure across potential member countries. Their assumption is that aggregate demand shocks are regime-specific while aggregate supply shocks are likely to be invariant with respect to changes in the exchange rate regime. In this study, we separate shocks to the economy into “global”, “regional”, and “country specific” shocks. The latter will be interchangeably called “domestic” shocks. Global shocks affect economies both inside and outside the regional boundary. Commodity price shocks can be an example of such shocks. Regional shocks are common to the economies within the region. German unification of 1989 and the resulting fiscal expansion may constitute a regional shock for European countries. In East Asia, large fluctuations in the yen–dollar exchange rate seem to have been a common, important regional source of disturbances (Kwan, 1994). Country-specific shocks are unique to a particular economy. They may be either from aggregate demand shocks that are associated with monetary or fiscal policies or supply shocks on productivity or the terms of trade. Regional shocks are expected to be important in a small open economy or in an economy with an economic structure similar to its trading partners or neighbors in the region. External shocks can extend regional boundary. Global shocks affect all countries in the same direction.
Following Chow and Kim (2002), we assume that global, regional and domestic price
indices –  ,
,  , and
, and  – are affected by three different types of shocks that arise from the global, regional
and the domestic markets and are denoted as
– are affected by three different types of shocks that arise from the global, regional
and the domestic markets and are denoted as  ,
,  and
and  , respectively. In a matrix form, it can be summarized as follows:
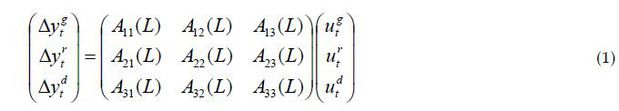
where 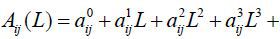 ... are polynomials of the lag operator L. For the identification of structural shocks, we employ the following 3 restrictions
of the Blanchard-Quah (1989) type based on the assumption that the individual economy is small in the region and,
in turn, the region is a small part of the world. 1) Regional shocks have long-run
effects on the global index; 2) Country-specific shocks have long-run effects on the
global index; 3) Country-specific shocks have no longrun effects on the regional index.
We impose these restrictions only in the long-run responses but not on short-run responses.
... are polynomials of the lag operator L. For the identification of structural shocks, we employ the following 3 restrictions
of the Blanchard-Quah (1989) type based on the assumption that the individual economy is small in the region and,
in turn, the region is a small part of the world. 1) Regional shocks have long-run
effects on the global index; 2) Country-specific shocks have long-run effects on the
global index; 3) Country-specific shocks have no longrun effects on the regional index.
We impose these restrictions only in the long-run responses but not on short-run responses.
The identifying assumptions imply that the cumulative effects of a shock on is equal to zero and so are the cumulative effects of the or shocks on . The assumptions can be restated in terms of impulse responses, 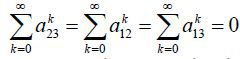 . We assume that each structural shock has unit variance and is uncorrelated to other
shocks.
. We assume that each structural shock has unit variance and is uncorrelated to other
shocks.
The importance of regional shocks – which affect countries in the region in a symmetric fashion – is taken as the indicator of similarity of economic structure within the potential member countries since, by construction, they affect each country in the group. On the other hand, the costs associated with a loss of monetary independence and flexible exchange rate adjustments could be heavy if dominant shocks are country-specific shocks and therefore uncorrelated across the region. For global shocks, a global rather than regional arrangement might be a better course of action in dealing with such shocks. In the context of East Asia, for instance, if global shocks (say, affecting U.S. output) are relatively more important than regional ones (say, affecting Japanese output), forming a dollar bloc may be a better policy choice than forming a yen bloc.
The overall stock price index is used as an indicator of macroeconomic performance to identify the three underlying shocks. Stock price data are ideal for our purpose since the availability of high frequency data as a proxy for macroeconomic performance can help us overcome the serious problem of having to work with a short-time span such as the post-crisis period, for which at best 6-7 years of data are available.15
We employ weekly price data from July 1, 1989 to November 11, 2011 for 12 stock exchanges in East Asia: Japan, China, South Korea, Hong Kong, Singapore, Malaysia, Taiwan, Indonesia, Thailand, the Philippines, Australia and New Zealand. For comparison, the model is first estimated for 16 European countries that consist of 11 EMU countries − Austria, Belgium, Finland, France, Germany, Greece, Ireland, Italy, Netherlands, Portugal, and Spain − and 5 non-EMU countries − Denmark, Norway, Sweden, Switzerland, and the United Kingdom.16 The proxy for the global price indexes is obtained from MSCI AC World Price Index. Similarly, we also employ MSCI AC Europe and MSCI AC Asia Pacific as the regional price index for Europe and East Asia.
Ⅳ. Empirical Results
We estimate a structural vector autoregressive model for two groups of countries separately: East Asia and Europe.17 The results of the forecast error variance decomposition for European and East Asian countries at 10-week forecast horizon are reported in Tables 2 and 3, respectively. Global shocks, regional shocks and country-specific shocks are denoted as ‘U-G’, ‘U-R’ and ‘U-D’ respectively. For brevity, we report only the variance decompositions of the domestic price index since the regional and global indices are mostly explained by regional and global shocks themselves. The pre-crisis and the post-crisis periods are defined as 1989:7:1 to 1997:6:30 and 1999:1:1 to 2010:11:11. The 18-month intervening period is dropped in estimation as a period of crisis and extreme volatility. Dividing the sample into the two sub-periods as mentioned above may not seem as compelling for European countries as for East Asian countries. Nonetheless, we maintain the same divisions for Europe and East Asia for consistency and also because a few previous years before the official introduction of the euro January 1999 were marked by extreme uncertainty and market volatility. For Europe, the two sub-periods are termed period I and period II.
Table 3 shows that global, regional, and country-specific shocks on average explain 33, 26, and 41 percent of the variations in the domestic stock price throughout the whole sample period. The table also shows that the role of country-specific shocks has declined over time in all countries without exception. Thus, in the post-crisis period, 34 percent of variations in the average stock price can be explained by its own market shocks in all European countries while they did more than 61 percent before the crisis. There seem to be large variations in the extent of integration among the countries. France, the UK, Germany and the Netherlands are among the most integrated in the post-crisis period. On the other hand, the stock prices in such countries as Greece, Austria, Ireland, Norway, and Portugal exhibit strong influence of country-specific factors.
The corollary of the above change in the role of country-specific shocks is the increase in the sum of the roles played by global and regional shocks. Global shocks became more important virtually in all countries. They explain 14 percent of domestic stock market price variations in the pre-crisis period. More than 45 percent of domestic price variations are explained by global shocks in period II. Regional shocks became less important slightly on average from 25 percent to 21 percent. The tendency appears to be nearly universal. (Exceptions are Belgium, Greece, Portugal, and Sweden, where the role of regional shocks increased by a small insignificant magnitude.) In short, there appears to be clear evidence of greater financial market integration in Europe over the past two decades or so. Financial integration has progressed mainly globally. The role of regional shocks seems to have declined somewhat.
One of interesting questions for Europe is whether the participation in the Eurozone make difference in the progress of financial integration.
According to Frankel and Rose (1998), the economic criteria for OCA such as highly correlated business cycles are evolving over time. Due to the strong and positive effects of a common currency on international trade which in turn have positive effects on business cycle correlation across countries, countries may satisfy the condition after than before they join in a currency area. It is interesting to note that, in terms of financial integration, there is little difference between the Eurozone countries and the rest as a group. All but five countries listed at the bottom of the table became members of the EMU. (Denmark, Sweden, and the U.K. decide to opt out. Norway and Switzerland are not part of the European Union.) A comparison of the two groups does not reveal any significant differences. There is no evidence that countries specific shocks are less important – and thus financially more integrated – in the Eurozone countries. Similarly, there is no indication that regional shocks are more important in those countries.
These results are reasonable given the fact that financial market openings pursued in European countries beginning in the 1980s have caused the stock market in each country to be more exposed to external/global shocks. It is also interesting to note that the introduction of the euro has accelerated the globalization of each stock market whether the country has become a member of the EMU or not. At same time, the fixed exchange rate arrangement under the European Monetary System (EMS) and the efforts of individual countries to participate in the single currency area seem to have gradually increased the extent of financial integration among the EMU and non-EMU members alike as indicated by the increasing role of regional shocks in virtually all European countries in the recent periods.
Table 4 reports the variance decompositions for East Asian economies. One cannot fail to notice sharp contrasts between Tables 3 and 4. First of all, in most East Asian economies, country-specific shocks are dominant in the determination of the domestic price index for the whole period estimation. They are responsible for 74 percent on average and for nearly 80 percent or more of changes in the local stock price index in all countries except Japan, Hong Kong, Singapore, and Australia. (This is not surprising given the open and advanced nature of the financial systems in these economies.) After the financial crisis, their role seems to have declined in all countries without any exception. In some cases, the decline is remarkable as in Korea, Hong Kong and Singapore. Nevertheless, they are still far more important than that can be observed in the European countries, explaining 70 percent or more in the majority of cases. China is also exceptional in that country-specific shocks continue to be dominant and there is little change in the post-crisis period explaining more than 90 percent variations in China’s stock prices are explained by its own domestic shocks.18
Regarding the role of external shocks, we find that there is a substantial increase in the role of global shocks in the post-crisis period in Korea, Hong Kong, Singapore, Taiwan, and Australia. For instance, 35 (24) percent of variations in the domestic stock price are explained by global shocks in Singapore (Korea) in the post-crisis period, up from 16 (5) percent in the period before the crisis. On the other hand, little change is observed in China and Malaysia. The two countries are well known in their response to the crisis, in particular, reinforcement or new imposition of capital controls. Regional shocks became more important in the post-crisis period. On average, their contribution doubled from 7 to 14 percent. The increased role is noticeable in Japan, Korea, Hong Kong, and Singapore. Malaysia is the only exception to the trend.
In European countries, financial development and the opening of the country’s stock market seems mainly in the form of the increased exposure to global shocks. Regionalization has already been established in period I as a result to long sustained efforts to achieve economic and political integration within the region. Thus, in terms of the percentage contribution, regional shocks became less important in period II. In East Asia, in marked contrast, both global shocks and regional shocks became more important in a balanced fashion although their joint contribution explains on average a third of variation in the stock price.
Ⅴ. Robustness Check
The results reported in the previous section appear reasonable. However, they may rest on some assumptions that may not be tenable. We thus investigate the robustness of the empirical results by considering various alternatives. For space reasons, we provide the results for post-crisis East Asia only. In Model B, we employ the Choleski decomposition as the method of identification, which imposes restrictions on the presence (or absence) of contemporaneous effects. The results are very close to the baseline model except the sharp decline in the role of regional shocks. Model C estimates the regression in levels with the Choleski decomposition. Given the fact that determining the presence of unit roots and whether the variables are cointegrated or not is difficult and subject to ambiguity, we estimate for Model C using levels in all variables. The results are also broadly similar to those of the baseline model except that the relative roles of global and regional shocks vary more than 10 percent in Japan, Hong Kong, Singapore, Thailand, and Australia.
In Model D, we employ the regional indexes that are obtained as weighted average of all individual country indexes using the market value of publicly traded shares as of December 31, 2010 (from CIA World Factbook).19 For the global index, we use the simple average of the US S&P 500 and the MSCI AC Europe-Price Index. Otherwise, it uses the same setup as the baseline model. The change in the definition generally increases the role of regional shocks and reduces that of global shocks while the combination of the two explains roughly the same fraction of the local stock price index as in the baseline. China is the most interesting case of all. Reflecting the influence of its economic size and international trade, its own stock price movements seem to be heavily reflected in the regional index. Thus more than 60 percent of its own index is identified by regional shocks themselves. The increase in the role of regional shocks in Hong Kong, Singapore and Taiwan seems to have the same root as that of China. Japan is the opposite case which loses its influence in the regional index to a substantial degree. It also appears that the Philippines, Australia and New Zealand are underrepresented in the construction of the regional index such as MSCI AC Asia Pacific. This result suggests that the nature of global and regional shocks is subject to a great deal of uncertainty. The absolute level of the role of their contributions on the local stock price index is less important than its variation over time.
In Table 6, we estimate the baseline model and its variation using monthly stock price index. Monthly averaging eliminates larger parts of idiosyncratic daily price movements than does weekly averaging used in the baseline model. The roles of the three shocks change substantially. First of all, country-specific shocks are much less important while global shocks become far more influential. On the other hand, the role of regional shocks is reduced to a minimum level. Once the influence of global shocks is taken into account, regional shocks play almost no role. This suggests that the universality of the stock price trend implied by the US and European stocks.
Ⅵ. Conclusion
This paper investigates the extent of global and regional financial integration in East Asia in the stock market. We employ a structural VAR model to separate the underlying shocks into “global”, “regional” and “country-specific” shocks. The estimation results show that country-specific shocks still play a dominant role in East Asia although their role appears to have declined over time, especially after the 1997 financial crisis. The roles of global and regional shocks have increased in the post-crisis period.
Comparison with the stock markets of the European countries reveals some interesting differences between the two groups of countries. First of all, East Asian stock markets are much less integrated globally or regionally. For instance, global and regional shocks account for two thirds of stock price movements in Europe but only one third in East Asia. Secondly, high level of regional integration in Europe seems to have already been achieved in the 1990s even before the introduction of the euro and further integration of the financial market has progressed in the direction of globalization. On the other hand, stock market integration in East Asia seems to be more balanced in that both global and regional factors have become more important over time.
The empirical results remain largely unaffected if we use levels instead of differences of variables or different identification schemes such as the Choleski decomposition instead of the Blanchard-Quah type long-run restrictions. However, the relative weights of global and regional factors strongly depend on the definitions of the global and regional indexes. For instance, using the weights based on the most recent market value of capitalization dramatically increases (reduces) the role of China and Hong Kong (Japan) in the regional factor. We also find that the results are sensitive to the frequency of data employed in the study. For instance, using monthly data instead of weekly significantly increases the role of global factors, which explains more than 50 percent of fluctuations in the stock prices. On the hand, regional shocks become negligible. This suggests that over the long term stock markets in East Asia follow the global trend
Our results also contradict the previous study by Eichengreen and Bayoumi (1999) who find that East Asian countries are almost as qualified as the EMU countries in terms of OCA criteria. We find that regional shocks tend to play increasingly more important role in East Asia as financial markets become more integrated with those of the United States and Japan. However, their roles are not as important as found in the EMU countries. We also find that the hypothesis of the endogenous OCA criteria may not apply to the financial market. In Europe, the extent of globalization or regionalization of the stock market seems to be hardly different whether a country participates in the EMU or not.
Some caveats remain. An investigation of robustness of the empirical results indicates that the global-regional-country specific decomposition depends on the definition of the regional and global indexes. Finding ideal indexes for the purpose remains a subject of future study. Likewise, the fact that decomposition depends on the frequency of the data – e.g., weekly or monthly – poses an important issue in empirical analysis.
Notes
자오 시아오단: (e-mail) xzhao@csbsju.edu, (address) Department of Economics, College of Saint Benedict-Saint John’s University, CSB Main 336, 37 South College Ave, St. Joseph, MN 56374-2099 김윤배: (e-mail) ykim01@uky.edu, (address) Department of Economics, University of Kentucky, Lexington, KY 40506
본 논문은 한국은행 금융경제연구 제403호에 동일한 제목으로 발간된 것을 수정·보완한 것이며, 2010년 8월 ‘KDI-KAEA Conference’와 2011년 11월 ‘Southern Economic Association Annual Conference’(Washington, D.C.)에서 발표된 것임을 밝힌다.
ASEAN consists of Brunei, Cambodia, Indonesia, Laos, Malaysia, Myanmar, Philippines, Singapore, Thailand, and Vietnam. 16 bilateral swap arrangements have been successively concluded by the 10th ASEAN+3 Finance Ministers’ Meeting in May 2007. The ASEAN+3 finance ministers also introduced a surveillance system to monitor the region’s economies and to encourage good policies via peer pressure.
This initiative has produced some visible results, including the issuance of Korean Collateralized Bond Obligations (CBO) with a guarantee by the Japan Bank for International Cooperation (JBIC) and the Industrial Bank of Korea (IBK).
From the discussion in 39th Annual Meeting of Asian Development Bank. The Asian Development Bank was to announce the details of the ACU in March 2006. However external pressures delayed this announcement although the concept was still being studied in detail.
There are noticeable drops in the role of country-specific shocks in Korea, Hong Kong, Singapore, Malaysia, Taiwan and Australia. The decline is not uniform though. There are wide variations between periods. There are substantial increases in the role of global shocks in Korea, Hong Kong, Singapore, Malaysia, Indonesia, and Australia while little changes in China.
Rose (2000) reports that bilateral trade between countries that use the same currency is over 200 percent larger than otherwise, controlling for other effects. Lee and Barro (2007) find that a currency union can generate welfare gains from the additional trade with countries belonging to the same currency union, which in turn stimulates an increase in consumption growth rates.
In the paper, the intra-regional trade ratio is defined as exports or imports within the region as a share of total exports or imports with the world.
The intrepid proposal for a regional alternative to the International Monetary Fund (IMF) seemed to arise without warning and at the worst possible moment. Both the Philippines and Indonesia had floated their currencies and the Asian Financial Crisis was increasingly showing signs of contagion at the time. The proposal raised temporary hopes among the crisis-ridden economies of Asia but elicited a stringent rebuke from the IMF and the US Treasury and ultimately fell to the wayside in favor of a more IMFcentered approach. See Phillip (2003).
Manila Framework terminated its function in November 2004 after 12 meetings. The failure of the Manila Framework is said to be attributable to the lack of mutual trust and lack of a professional secretariat.
The Japanese Ministry of Finance and the Ministry of Finance of Malaysia have reached an agreement regarding the basic features of the short-term financing facility under the framework of the "New Miyazawa Initiative". The facility is aimed at supporting credit-extending schemes which intend to promote economic activities in Malaysia, such as a trade financing facility, small and medium size enterprise credit line, etc. This will serve as a standby facility for the Malaysian Government should the need arise. In this short-term facility, the Japanese Ministry of Finance is committed to providing up to US$ 2.5 billion liquidity to Bank Negara Malaysia, if and when necessary, through swap transactions between the US dollar and the Ringgit.
Japan concluded six agreements with China, South Korea, Thailand, the Philippines, Indonesia and Malaysia: two-way arrangement with China, Korea, Thailand, and the Philippines and one-way arrangement with Indonesia and Malaysia. Korea concluded four agreements in addition to Japan-Korean BSA. China concluded four agreements in addition to its agreements with Japan and Korea except with Singapore. See Table 1 for details. Figure is from Ministry of Finance, Japan.
At the 6th ASEAN+3 Finance Ministers’ Meeting in August 2003 at Manila, the Philippines, finance ministers agreed to promote Asian bond markets.
A robust primary and secondary bond market in Asia requires a wide variety of issuers and products that could be addressed by encouraging: (1) Sovereign bond issuance by Asian governments to establish benchmarks; (2) Asian government financial institutions to issue bonds in Asia to meet their financing requirements; (3) The creation of asset-backed securities markets, including collateralized debt obligations (CDOs); (4) Bond issuance in the region by multilateral development banks and government agencies; (5) Bond issuance in the region for funding foreign direct investment in Asian countries; and (6) The expansion of local currency-denominations of bonds and the introduction of currency-basket bonds.
At the ASEAN+3 Finance Ministers’ Meeting (AFMM+3) on August 7, 2003, six voluntary working group (WG) on the ABMI have been established to address key areas of bond market development. Since the establishment of the six WGs, comprehensive efforts have been made to develop regional bond markets.
Fama (1990) showed that stock returns are actually significant in explaining future real activity for the whole period from 1953 to 1987 in the United States stock market. Quarterly and annual stock returns are highly correlated with future production growth rates. According to the reported regressions past stock returns are significant in explaining current production growth rates and vice versa. Merton (1984) found that movements in the United States stock prices were positively correlated with real GNP. Schwert (1990) showed that Fama’s results could be replicated by using data that goes back as far as to 1889. He finds the correlation between future production growth rates and current stock returns to be robust for the whole period from 1889 to 1988. However, Binswanger (2000) concluded that traditional links between stock market performance and two major macroeconomic indicators, production and GDP, broke down in the most recent United States bull market. Although the regressions of stock returns on measures of real activity in the United States over the period from 1953 to 1997 seem to confirm the findings of Fama (1990), stocks returns do not reflect real activity in the current stock market boom from 1984 to 1997. In recent research, Mao (2007) found the links between stock prices and industrial production or GDP remained strong during the high-growth phase since 1980s in the Australian stock market.
Kaminsky and Reinhart (1999) show that stock price indices are a significant predictor of currency crisis. As the crisis nears, changes in stock prices are about 40 percent below those observed in non-crisis periods. Weakening equity prices reflects both deteriorating cyclical position of the economy and reduced foreign demand as capital inflows are reversed and worsening balance sheets of firms. The beginning of a recession is also reflected in the stock market, which collapses a year before the crisis.
For unit-root tests, not reported here for space reasons, we employ the augmented Dickey-Fuller (ADF) test, the Schmidt-Phillips (SP) test, and the Kwiatkowski-Phillips-Schmidt-Shin (KPSS) test. The null hypothesis for the ADF and the SP tests is that the stock price index is non-stationary. A time trend is included in all regressions; the number of lags used in the unit root tests is determined using the optimal lag length tests based on the Akaike Information Criterion (AIC), Hannan-Quinn Criterion (HQC), and Schwarz Criterion (SC). (Typically, all three criteria report the same results. When they are different, we take the result indicated by the AIC criterion.) The null hypothesis that the stock price index is nonstationary cannot be rejected for any East Asian countries with the ADF and SP tests. For the KPSS test, the null hypothesis is that the stock indices are stationary, which is rejected at the conventional significance level. When the same tests are applied to the first differences of the series, the unit-root null is strongly rejected with the ADF and SP tests and the stationarity null is not rejected with the KPSS test. These results suggest that all the series contain a unit root and thus should be first differenced to achieve stationarity. The empirical results are available upon request.
The China stock exchange used to separate the market into A share and B share markets. Foreign investors, who were allowed to participate only in B shares, can invest in the A share market after December 2002. The results seem to suggest that numerous remaining restrictions might still limit the size and effect of external influences on the local stock market of China.
References
, & (1998). Measuring Monetary Policy with VAR Models: an Evaluation. European Economic Review, 42(6), 1069-1112, https://doi.org/10.1016/S0014-2921(98)00005-1.
, & (2002). Fear of Floating. Quarterly Journal of Economics, 117, 379-408, https://doi.org/10.1162/003355302753650274.
, & . (2005). China’s Role in East-Asian Monetary Integration. International Journal of Finance and Economics, 10, 157-166, https://doi.org/10.1002/ijfe.265.
, & . (2003, May). A Common Currency Peg in East Asia? Perspectives from Western Europe. Journal of Macroeconomics, 25, 331-350, https://doi.org/10.1016/S0164-0704(03)00041-7.
. (1990). Stock Returns, Expected Returns, and Real Activity. Journal of Finance, 45, 1089-1108, https://doi.org/10.1111/j.1540-6261.1990.tb02428.x.
, & (1998). The Endogeneity of the Optimum Currency Area Criterion. Economic Journal, 108, 1009-1025, https://doi.org/10.1111/1468-0297.00327.
, & . (2002). An Estimate of the Effect of Common Currencies on Trade and Income. Quarterly Journal of Economics, 117(2), 437-466, https://doi.org/10.1162/003355302753650292.